
Result page is the main overview page for channels that are tagged as key performance indicators (KPI) and system channels. CALMS is aligned with the requirements of standard ISO 50006, Energy management systems — Measuring energy performance using energy baselines and energy performance indicators (KPI) — General principles and guidance, adapted for compressed air system.
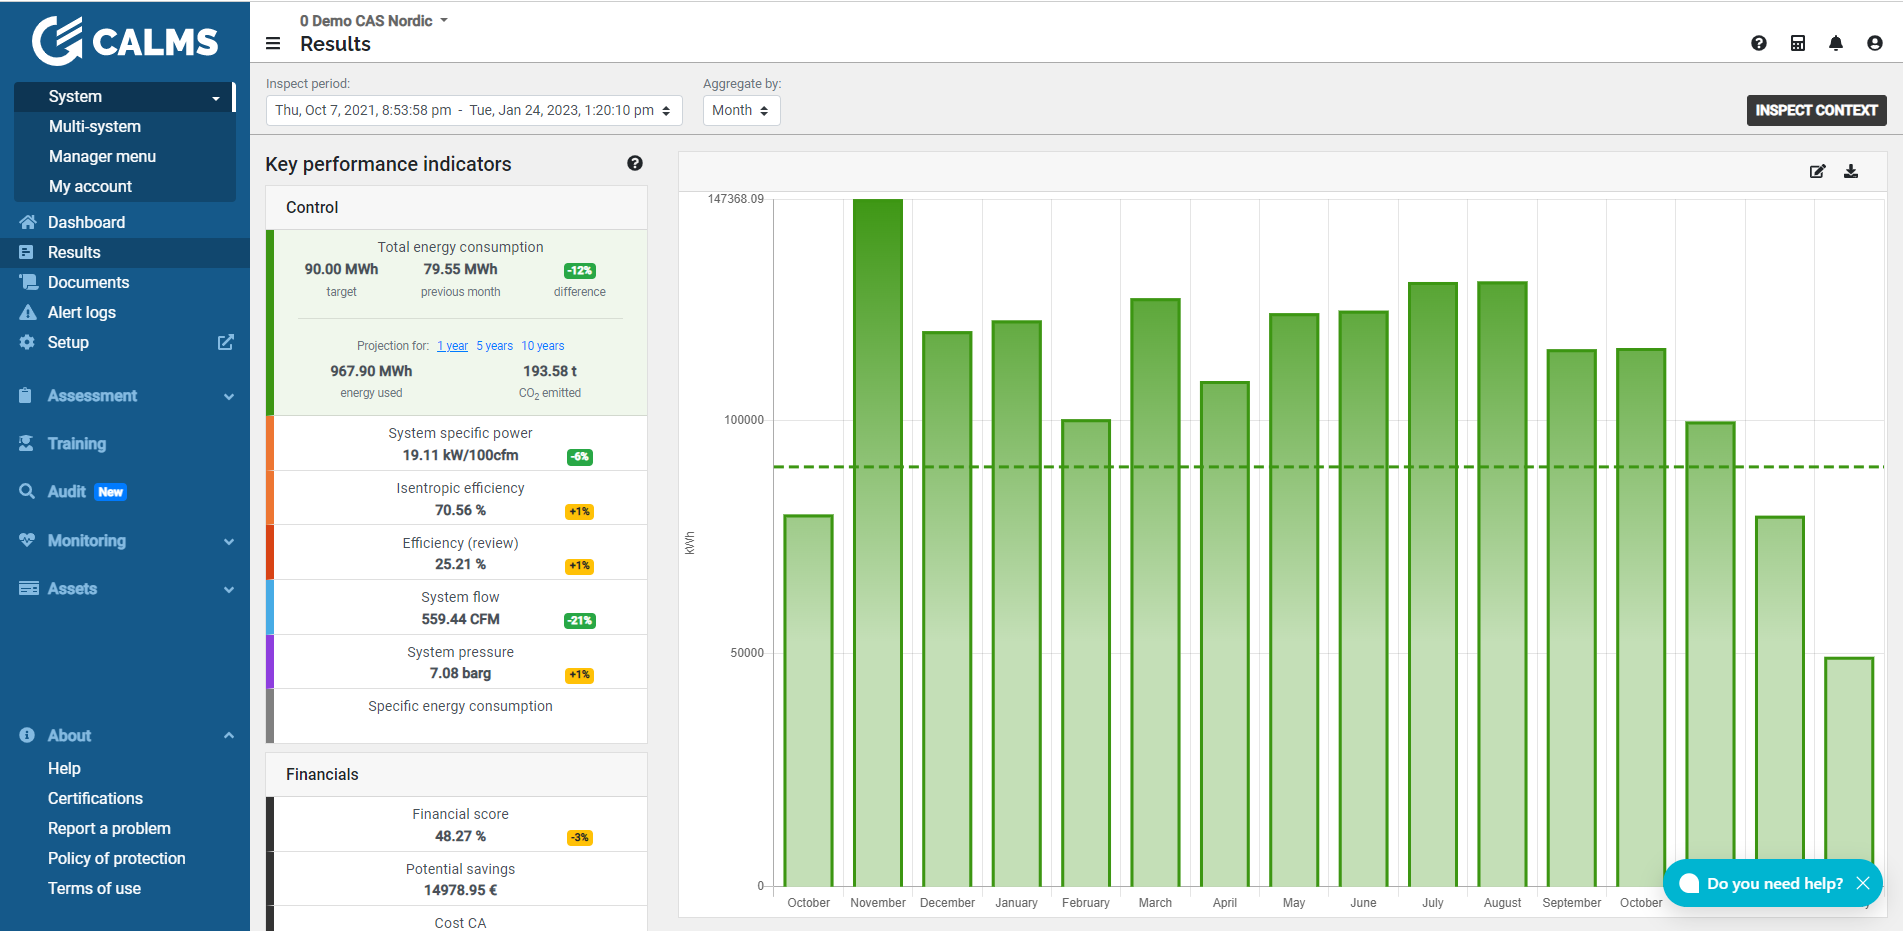
Channels can be selected on the right side where you can see also target value vs. channel value and difference with savings potential valid for selected Reporting period ( week, month, year, all times data).
All values on the result page are aggregated values as selected under Baseline period which is set to 1 month. User can select different baseline on Result page for comparing different periods (hour, day, week, month, year).
Baseline period is specific period of time during which calculated or collected data will be used for comparison with the data collected and calculated during the reporting period.
Notes: Baseline period is used for comparing energy performance:
- Energy baseline reflects a specific period of time.
- Energy baseline may be normalized using variables that affect energy use and or consumption. Examples: production level, operating hours, etc.
- An energy baseline may also be used for calculation of energy savings, as a reference for before and after implementation of energy performance improvement actions.
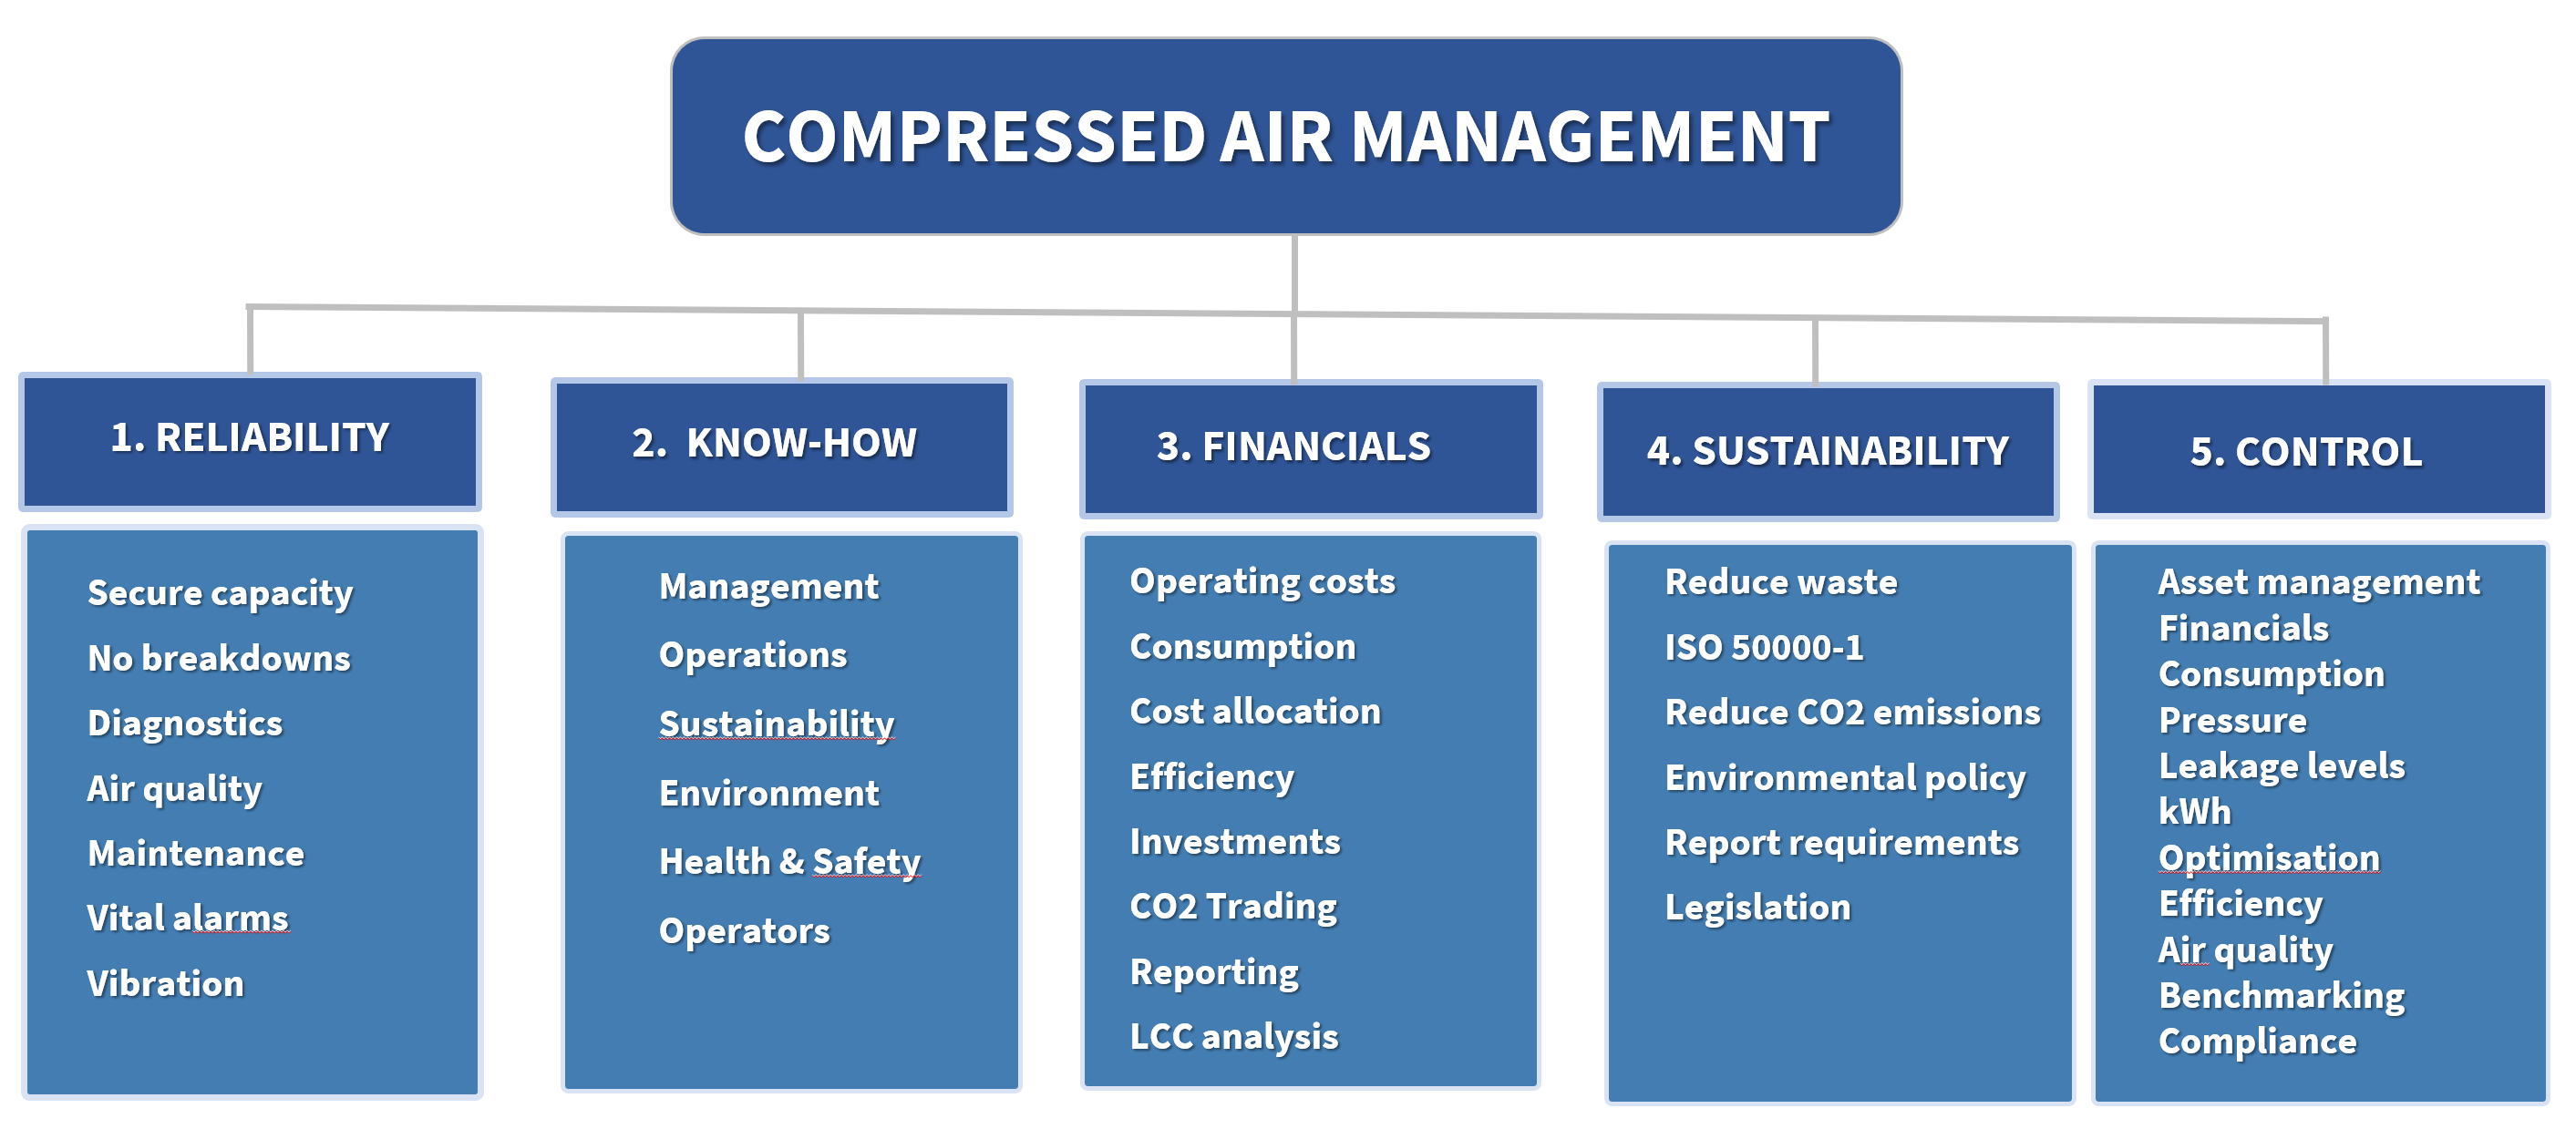
CALMS is designed as complete system management with key performance indicators focus on reliability, training, finances, sustainability and control.
System performance
Under System performance CALMS will show trend graph for selected KPI channel with aggregated values based on baseline period and compare it with target line.
Annotations
For a more detailed explanation about annotations, please refer to monitoring page - annotation tool and monitoring page - annotation card.
The results graph takes the same annotations from the aforementioned monitoring page, but only displays comment and event annotation types. These annotations are displayed directly on the plot above each data point (vertical bar plot). By default, a flag icon (⚑) is used to indicate that the data point includes some type of annotation. You can show/hide a more detailed view of the annotations by clicking on the respective data point.
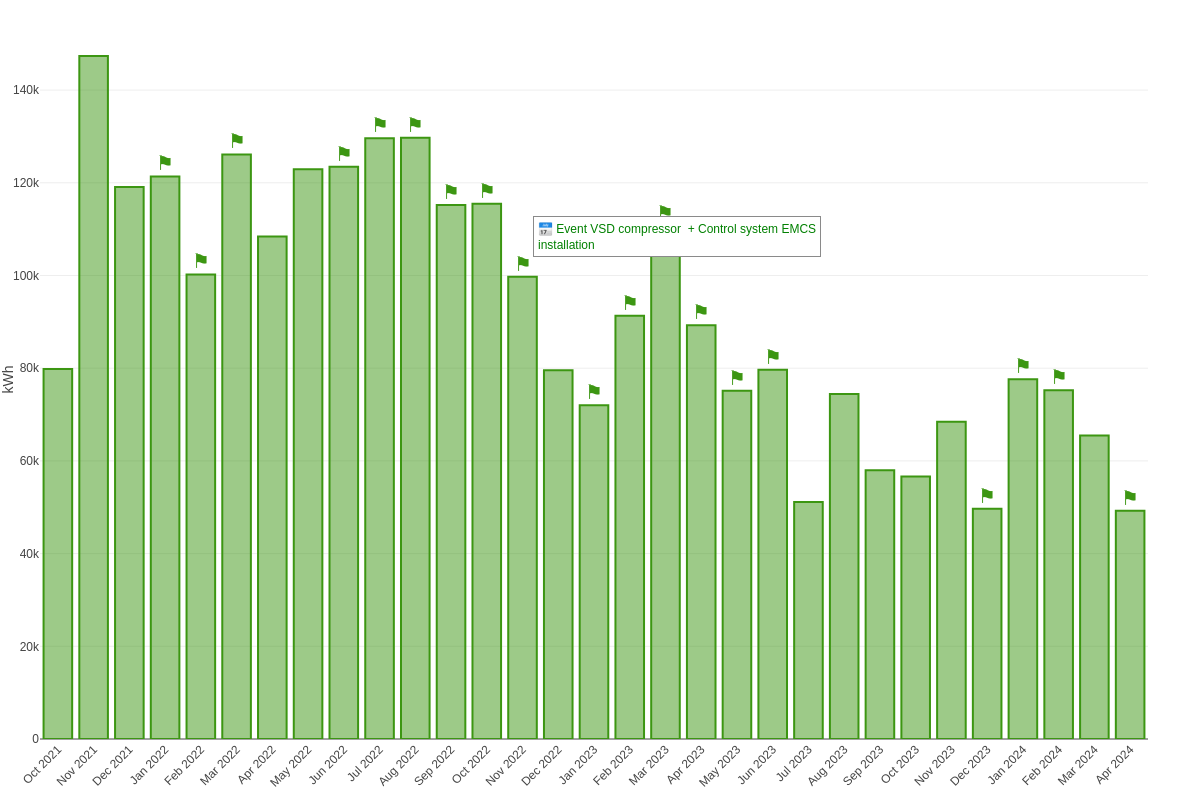
These annotations are also included in the downloaded graph image.
Pro Tip: Enhance your graph by using the online chart editor. Simply click the pencil icon labeled “Edit in Chart Studio” to access a versatile editor. Here, you can customize your graph—add titles, adjust annotations, modify styles and colors, and more—using the original data. This tool is ideal for refining graphs for presentations and reports.
Insights
Get Insights into Compressed Air
Insights help you understand how your system compares with other systems in your class range.
When you use Insights, CALMS will show you suggestions to help you reach your goals, and you can see how you compare to the CALMS and Towards Zero community.
CALMS uses your uploaded system measurements data to provide Insights to you as statistical data, but your personal data is never shared with others.
If you choose not to contribute your uploaded data to Insights, the feature will be turned off, comparisons will be disabled and your existing Insights will be deleted.
For each selected KPI channel you will get Gaussian distribution based on statistical data for similar systems.
Your system stats are refreshed daily and may not appear immediately after syncing.