
Overview
Sections are a way to customize your reports to your liking. You can add more section by opening report details and clicking the add sections button. This will open a modal window with all sections listed and categorized.
General sections
The general sections show general information about the system, mostly information from the setup page.
Title page
Title page section is a full page section that is often used for the first page of the document.
It contains:
- Report name
- System title
- Company title
- (Optional) Revision table
Compressor details
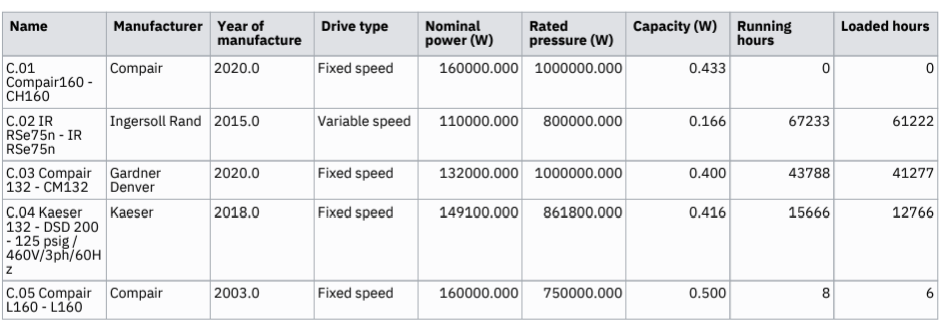
Compressor details section contains basic information about compressors added in the system schema. It contains information about their nominal values and load states.
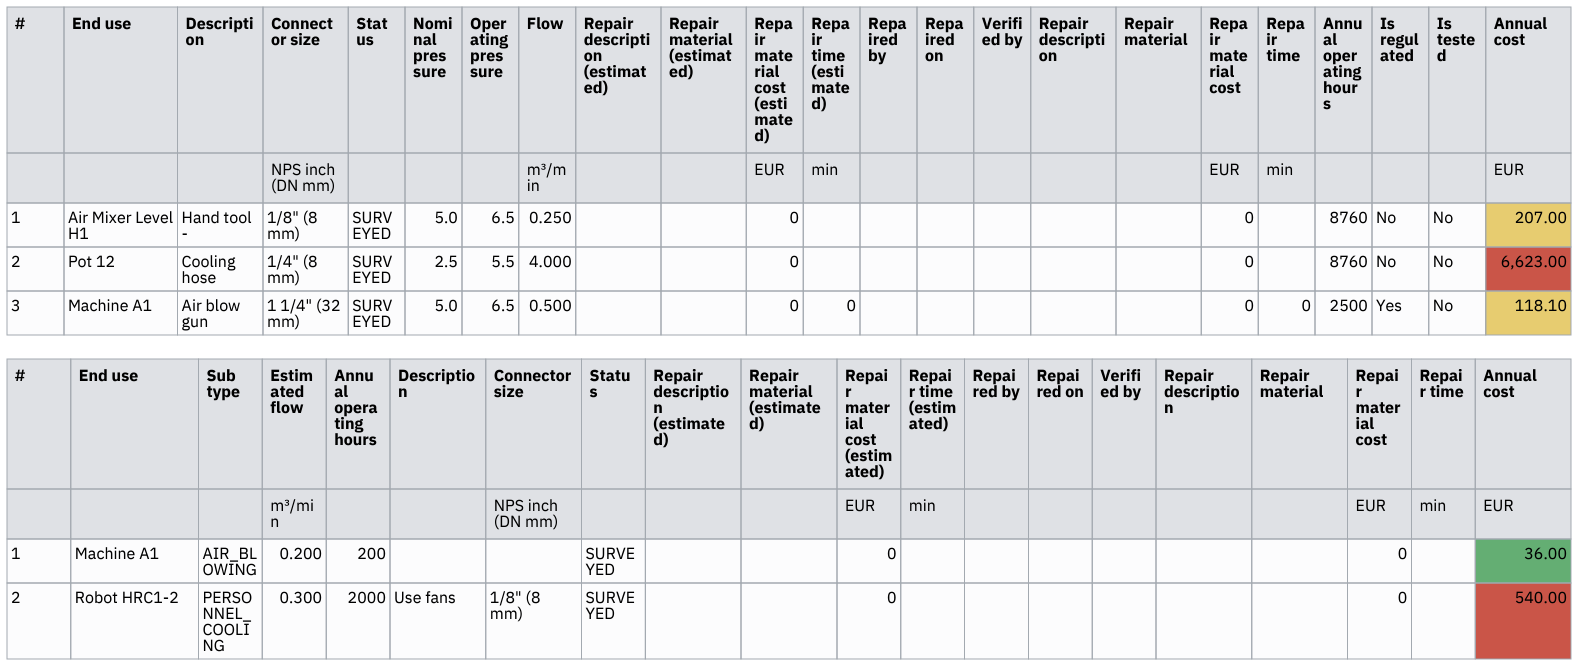
End use details
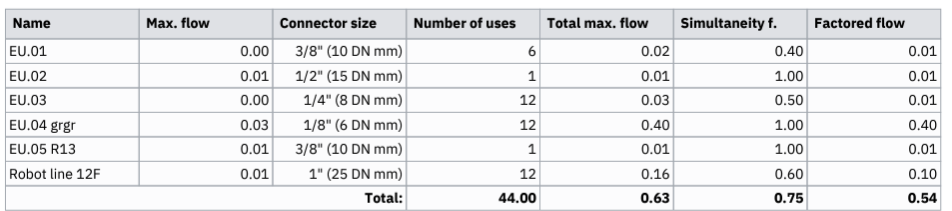
End use details section contains basic information about end uses added in the system schema.
Alerts
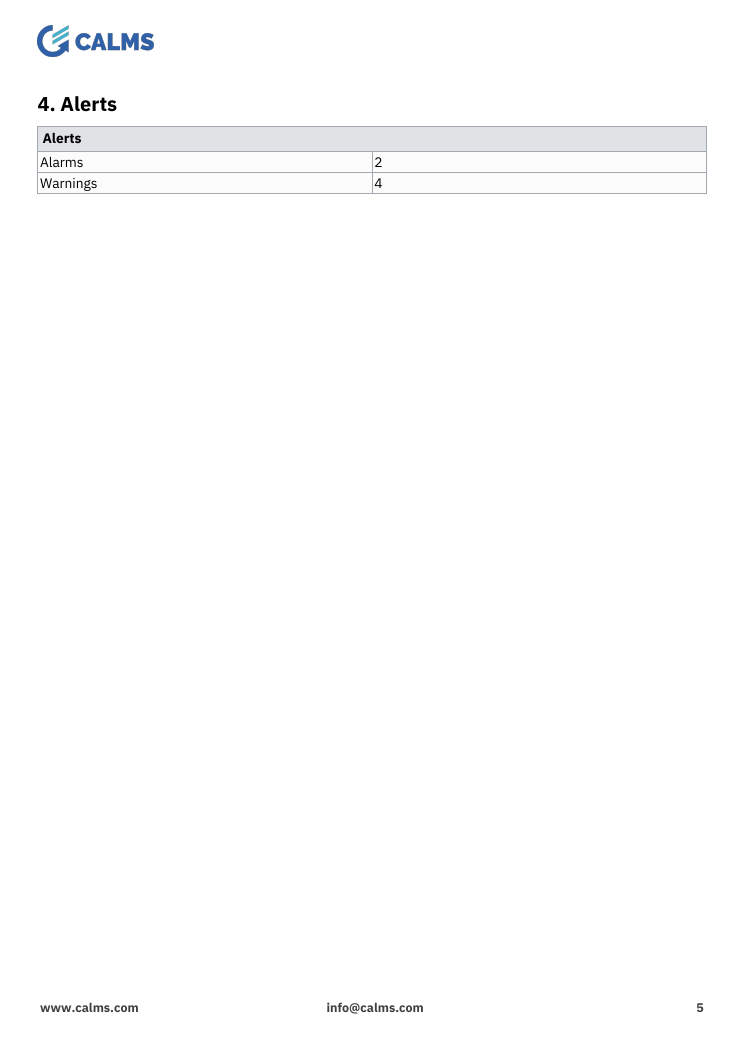
Alerts section contains all alert logs for the report selected period.
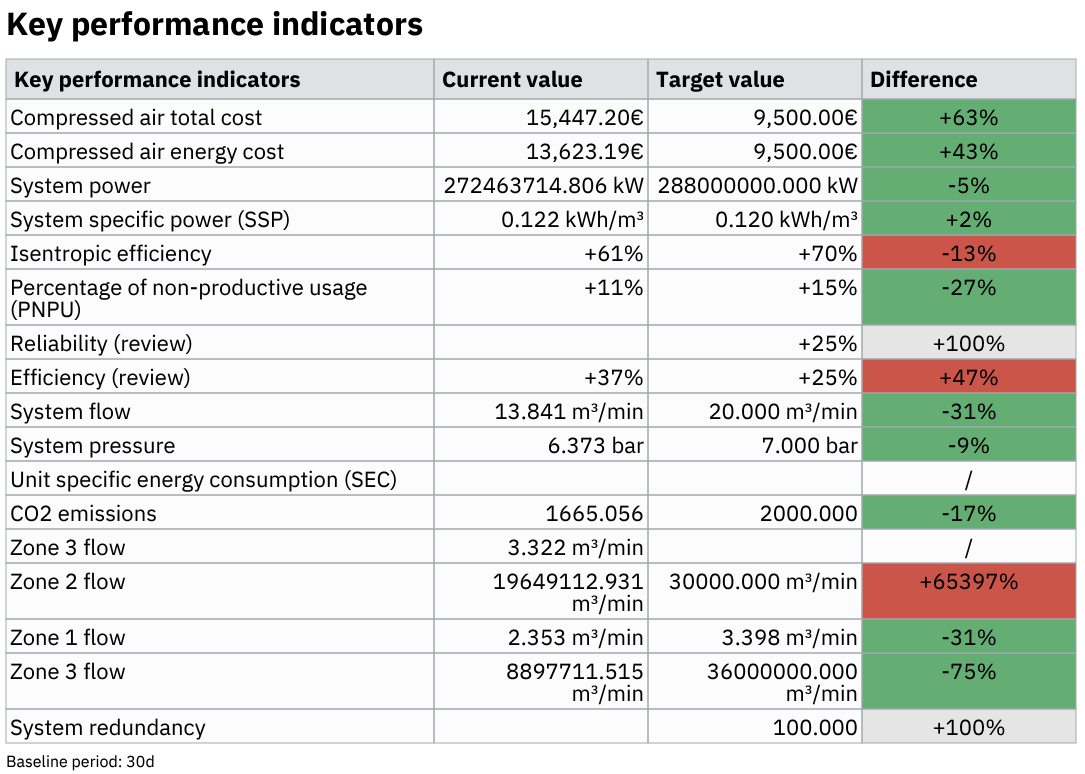
Key performance indicators
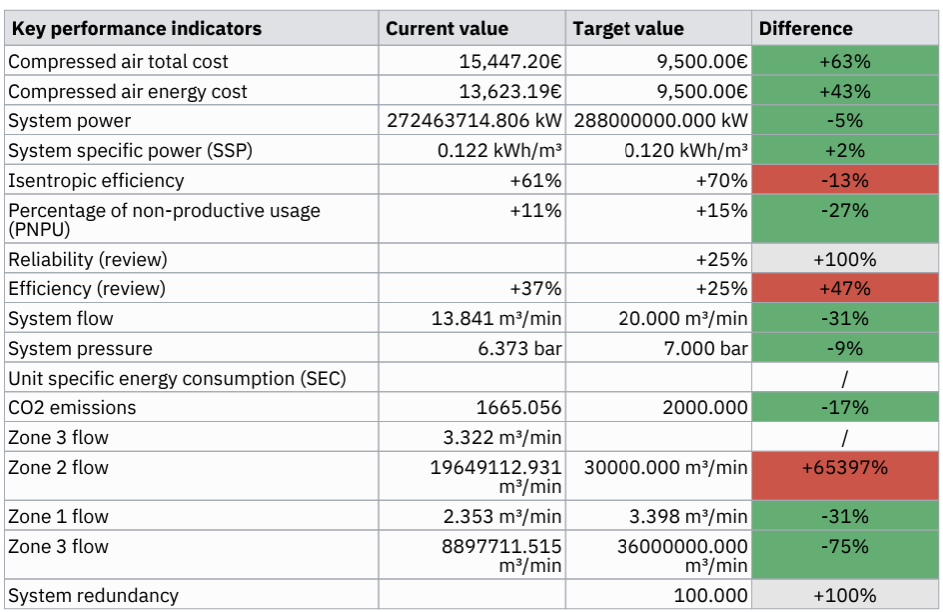
Key performance indicators section shows all indicators, their targets and values. Shows values for baseline (30 days).
Scheme
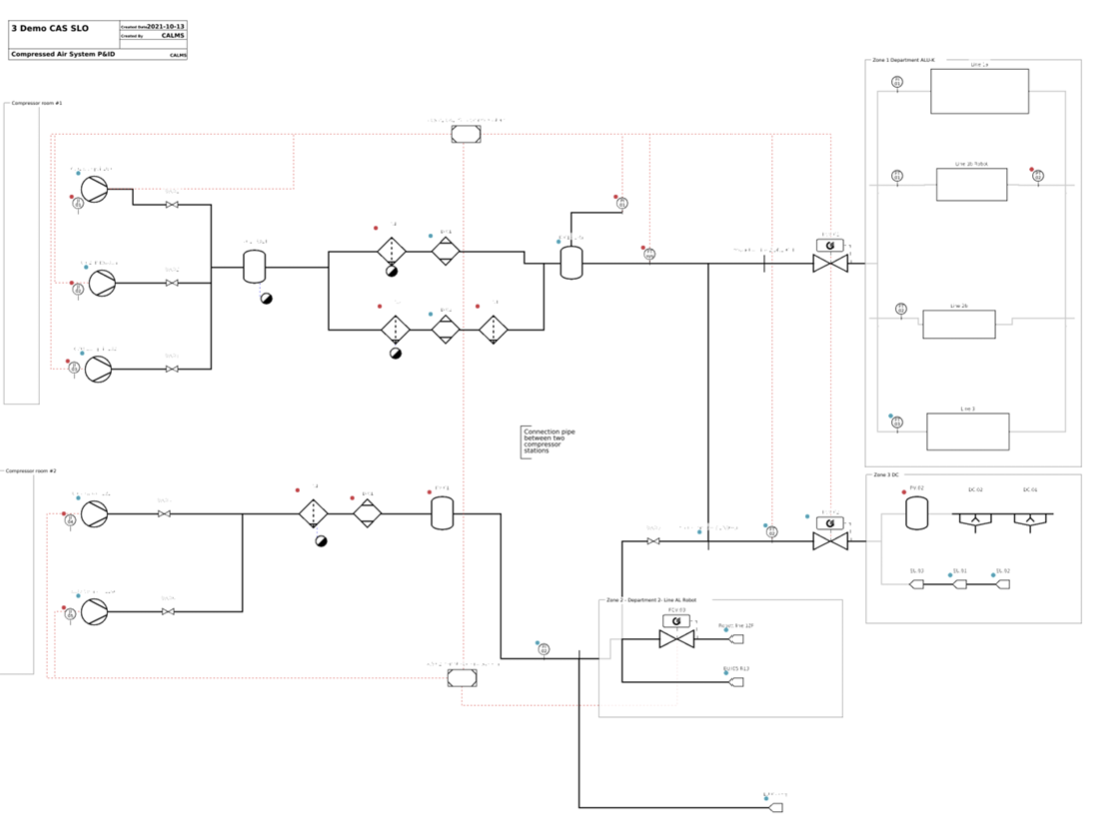
Scheme section shows the systems PID diagram.
System energy label
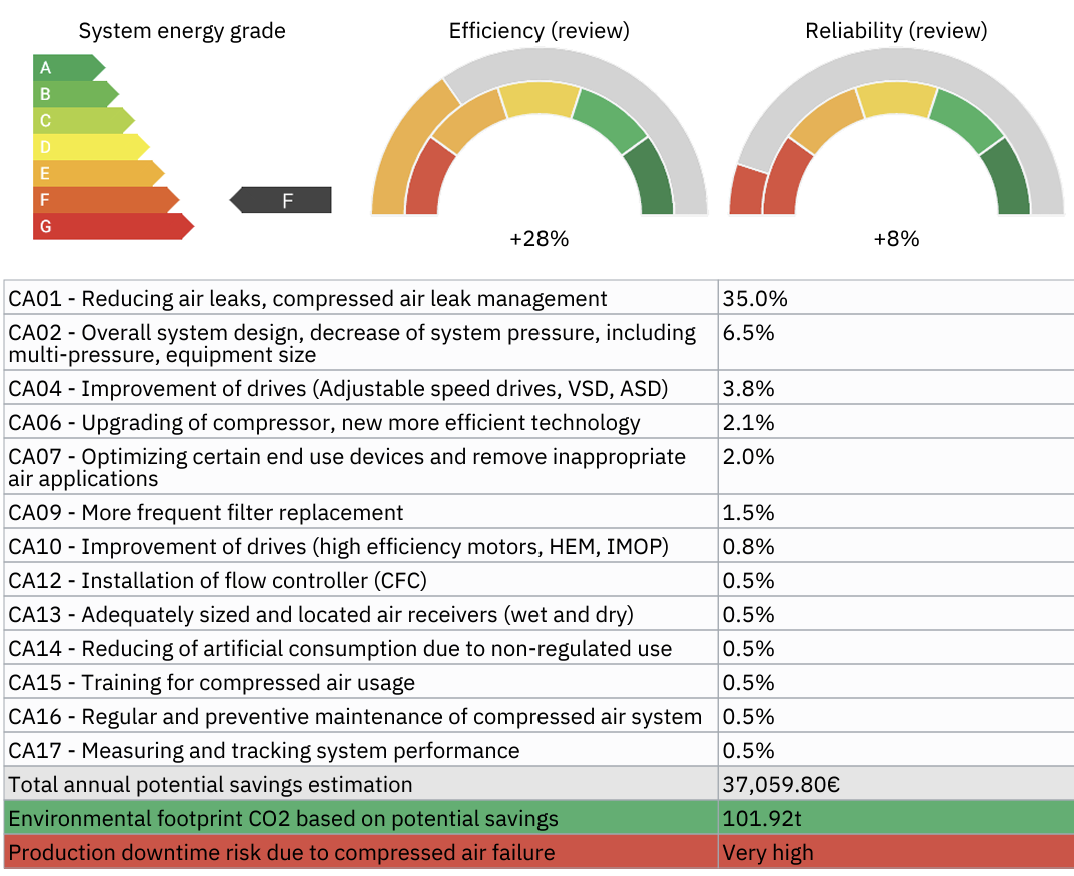
System energy label section shows system’s energy grade, efficiency and reliability and a list of potential savings based on the selected or latest review.
Invoice
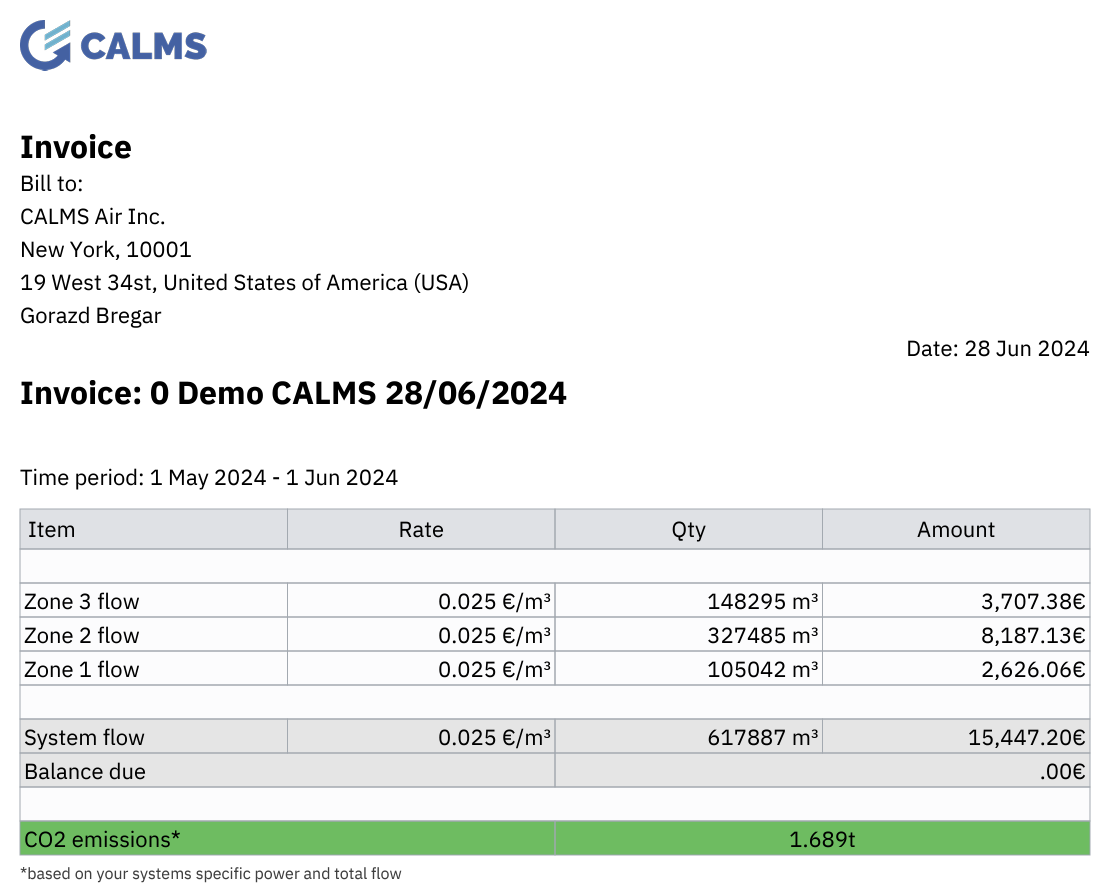
Invoice section shows system air consumption in an invoice format, based on system flow and system specific flow
It contains:
- company name, address, location, contact person
- system name, timezone
- report time period
- system flow and co2 info
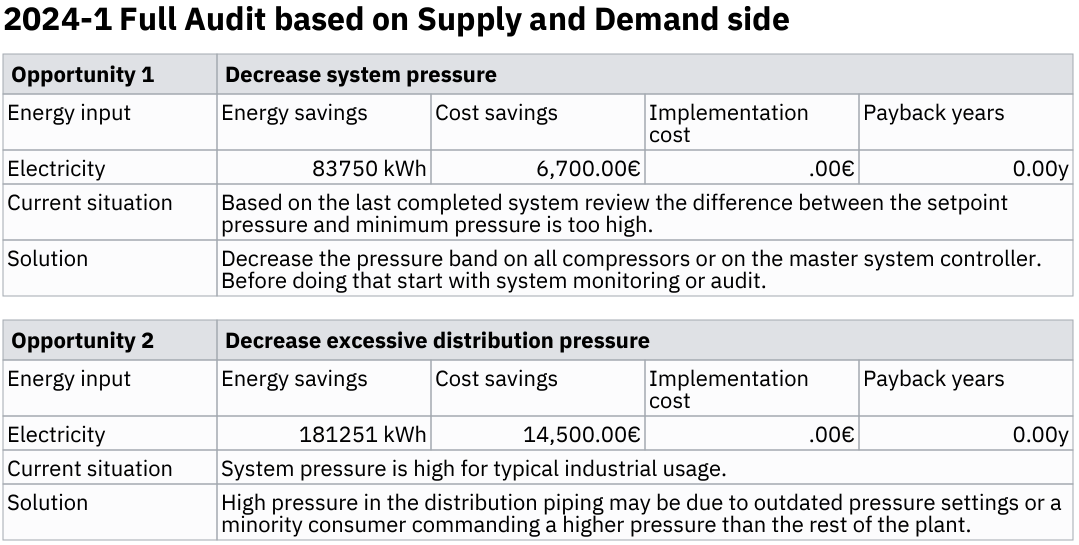
Optimization actions
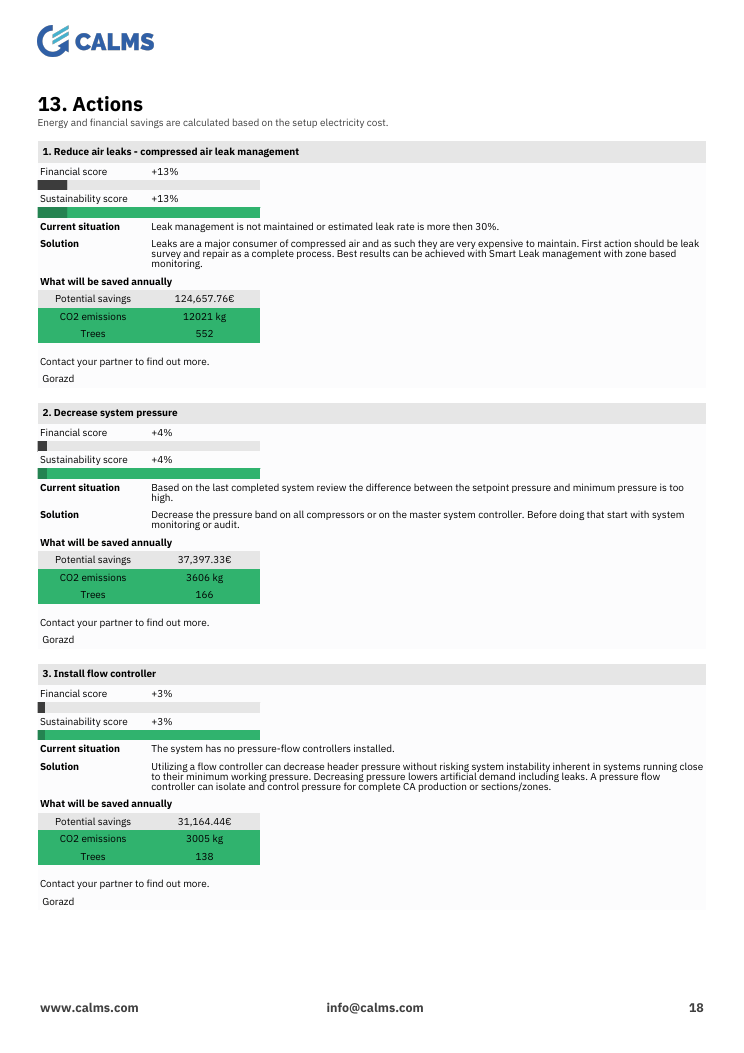
Optimization actions section shows up to three optimization action cards, sorted by highest financials average. It also shows contact info of the system manager with his phone number.
Compressor details
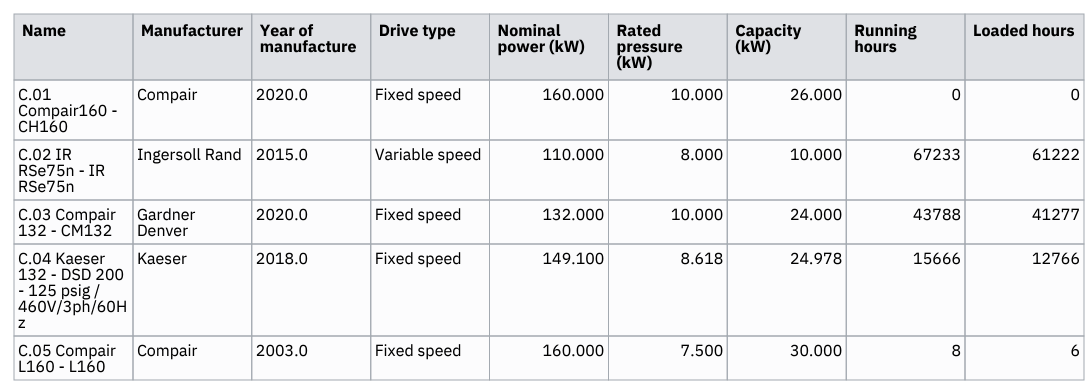
Compressor details section contains basic information about compressors added in the system schema.
Data reference sheet
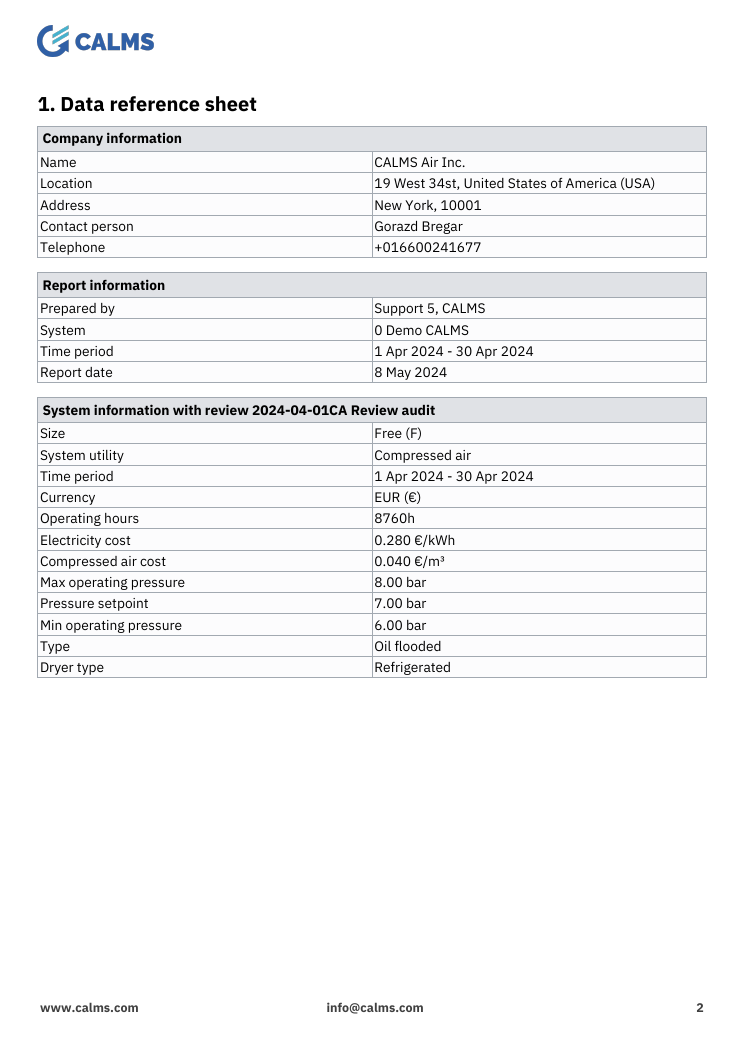
Data reference sheet action shows the various data used in the generated report. Data is gathered from the review (if existing), report and system setup values.
Signal list
Signal list section shows edge devices in system and their link configuration.
Text
Text section is a block of text defined by the user when creating the report.
Image
Image section is an image uploaded by the user when creating the report.
Index
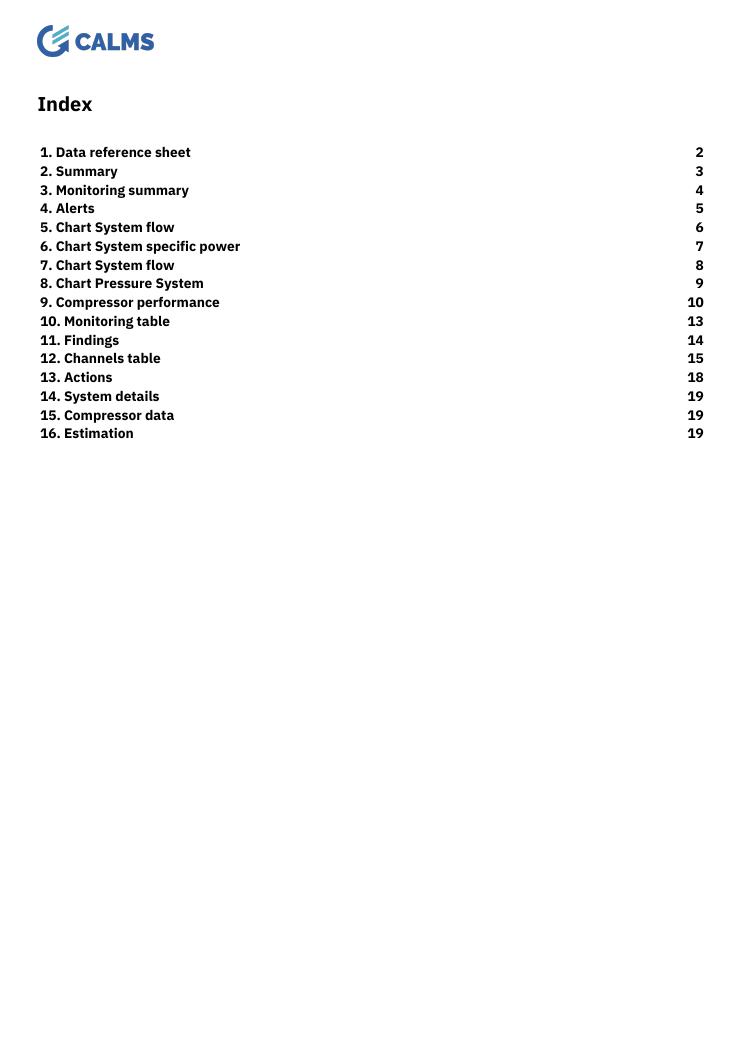
Index section shows an index of report sections. It appears in the report if the user selects the option Indexed. You can click on the titles in the index to jump to the relevant section.
Review sections
Note: All review sections are based on the selected review. If no review is selected when creating the report, then the latest review is used.
Review expanded details
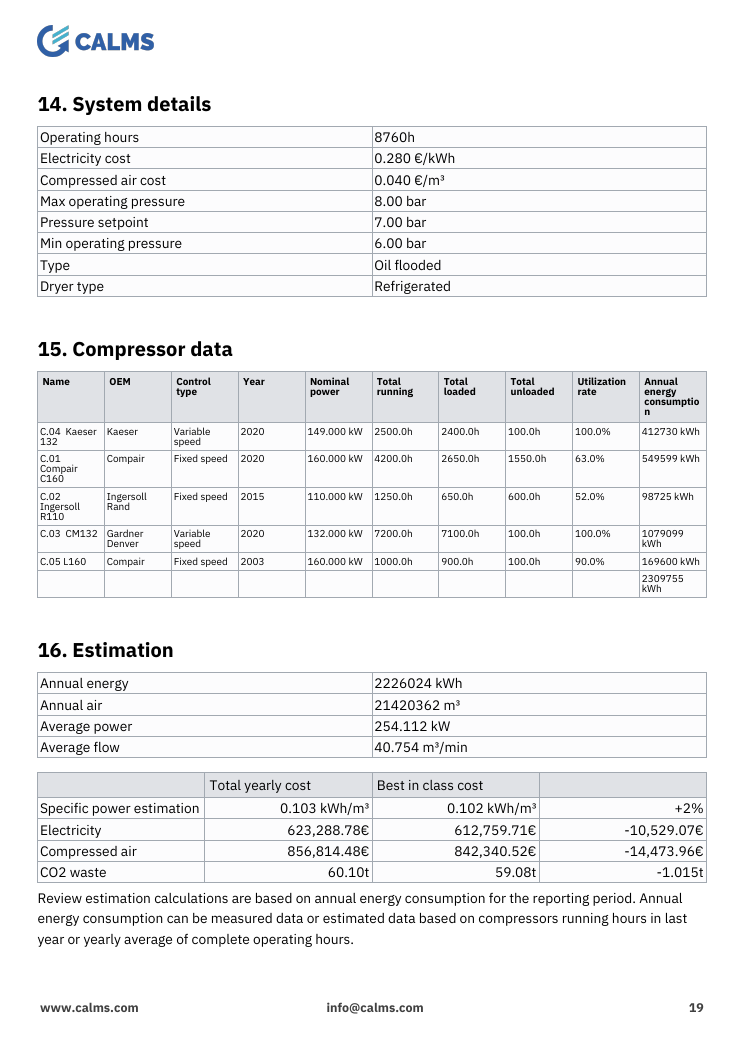
Review expanded details section shows the system details entered in the review, usually during an audit.
It contains:
- All entered review system details
- All entered review compressor data
- A rough estimation of annual costs and possible savings
Review potential savings
Review potential savings section shows potential estimated savings entered in the review, usually during an audit.
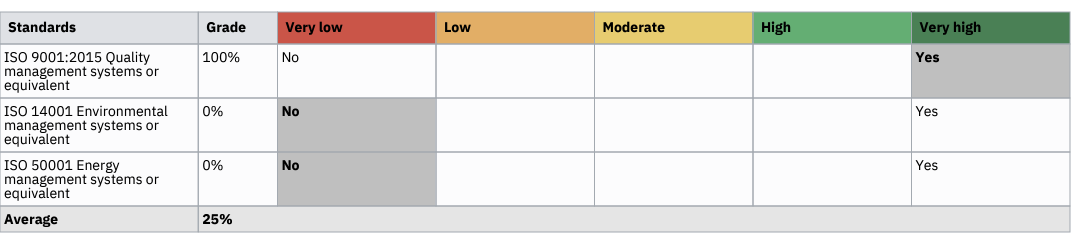
Efficiency
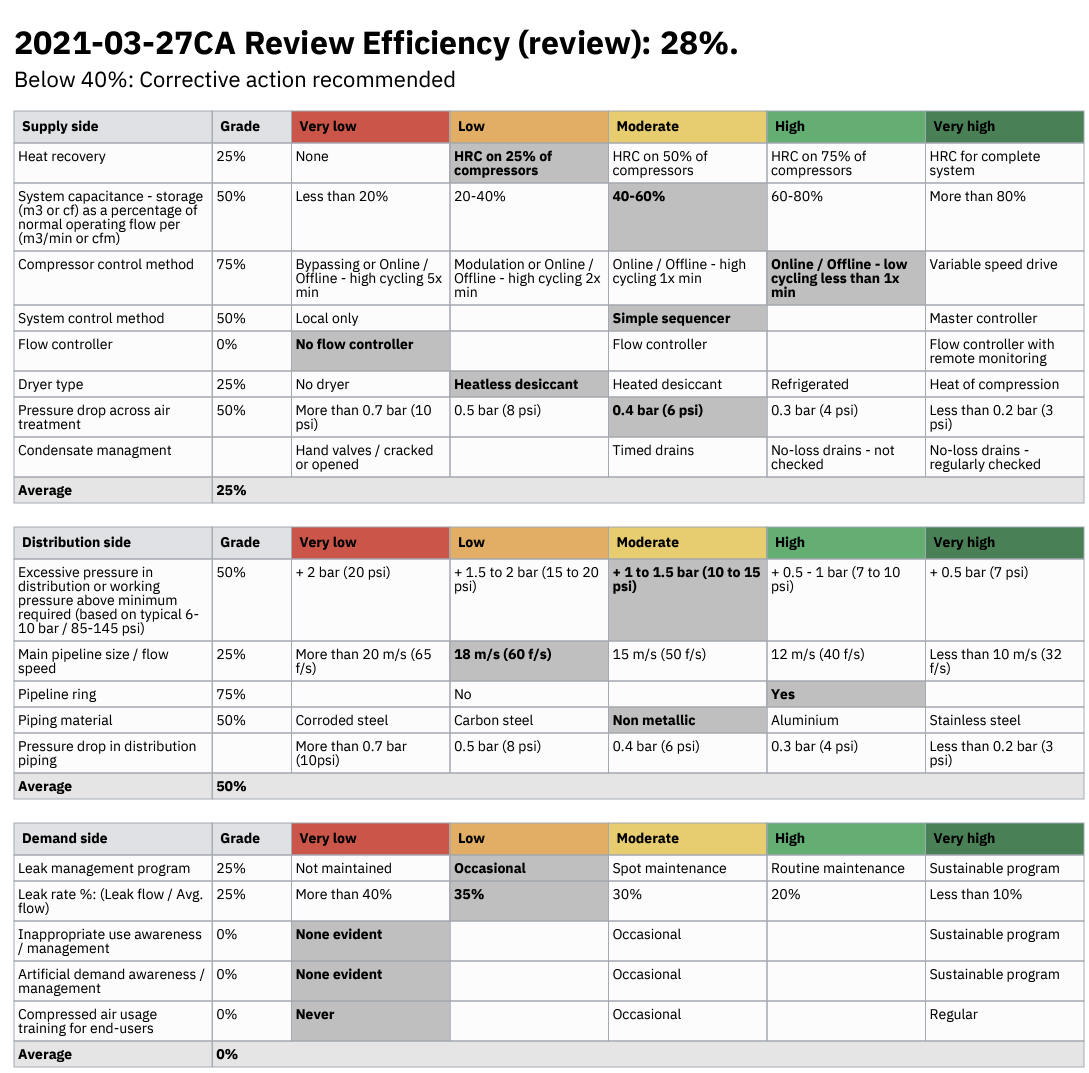
Efficiency section shows the efficiency score and a table of efficiency questions with answers.
Reliability
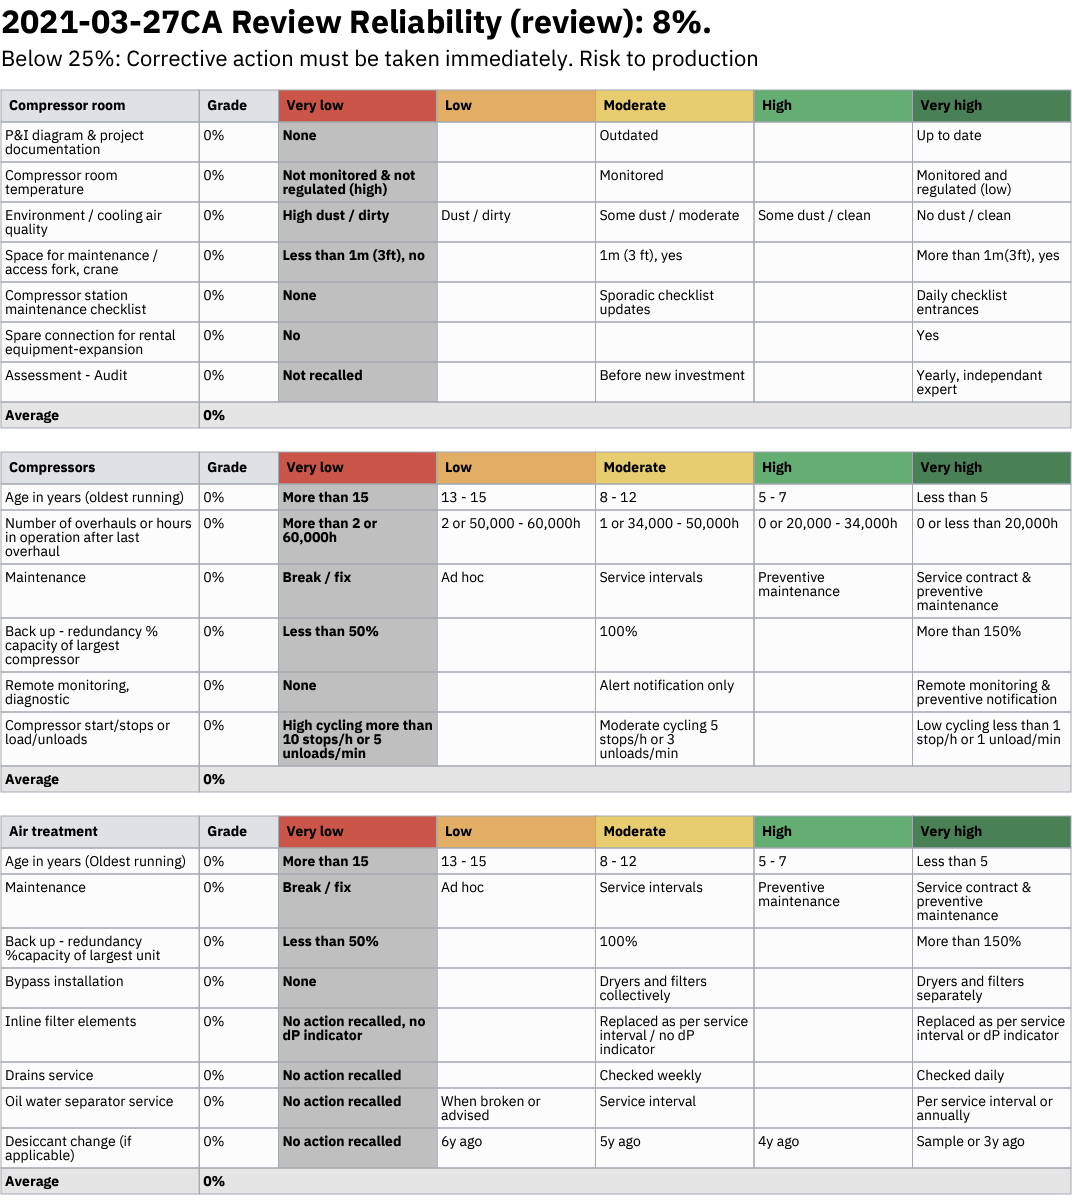
Reliability section shows the efficiency score and a table of reliability questions with answers.
Notes
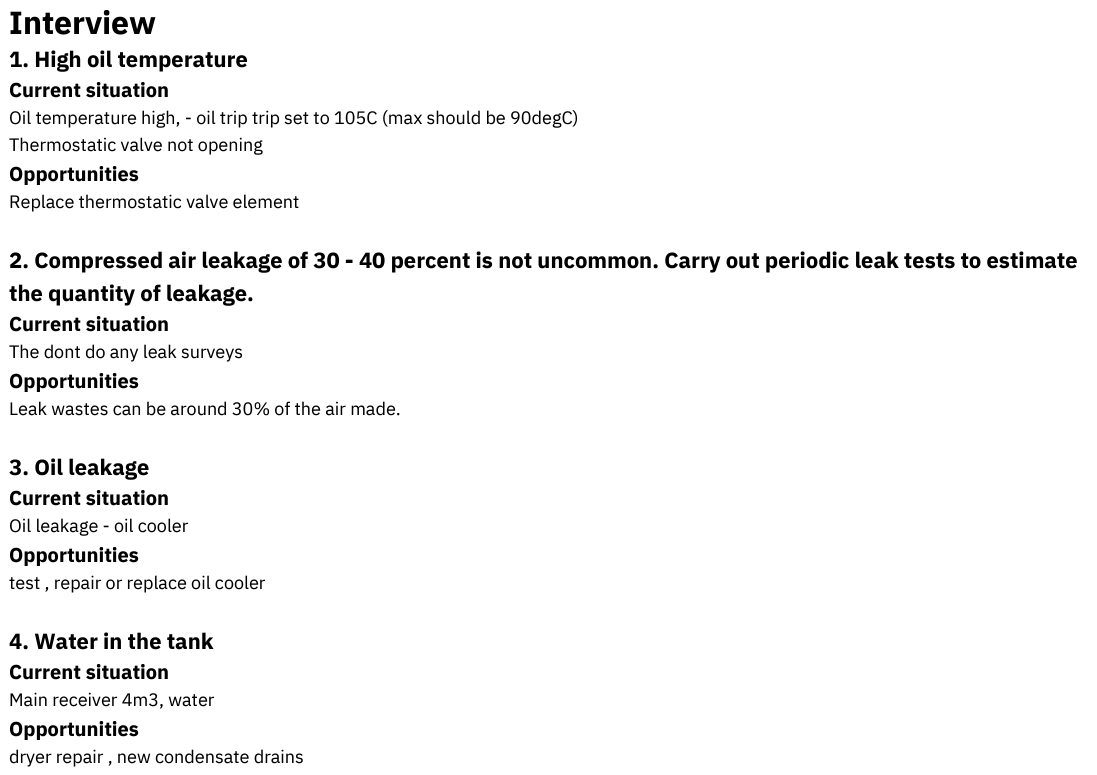
Notes section shows question and answers written in the review notes.
System assessment
System assessment section shows a short system summary assessment based on the review and wastes.
Wastes sections
Note: All wastes sections are based on the selected waste assessment. If no waste assessment is selected when creating the report, then the latest waste assessment is used.
Waste size distribution
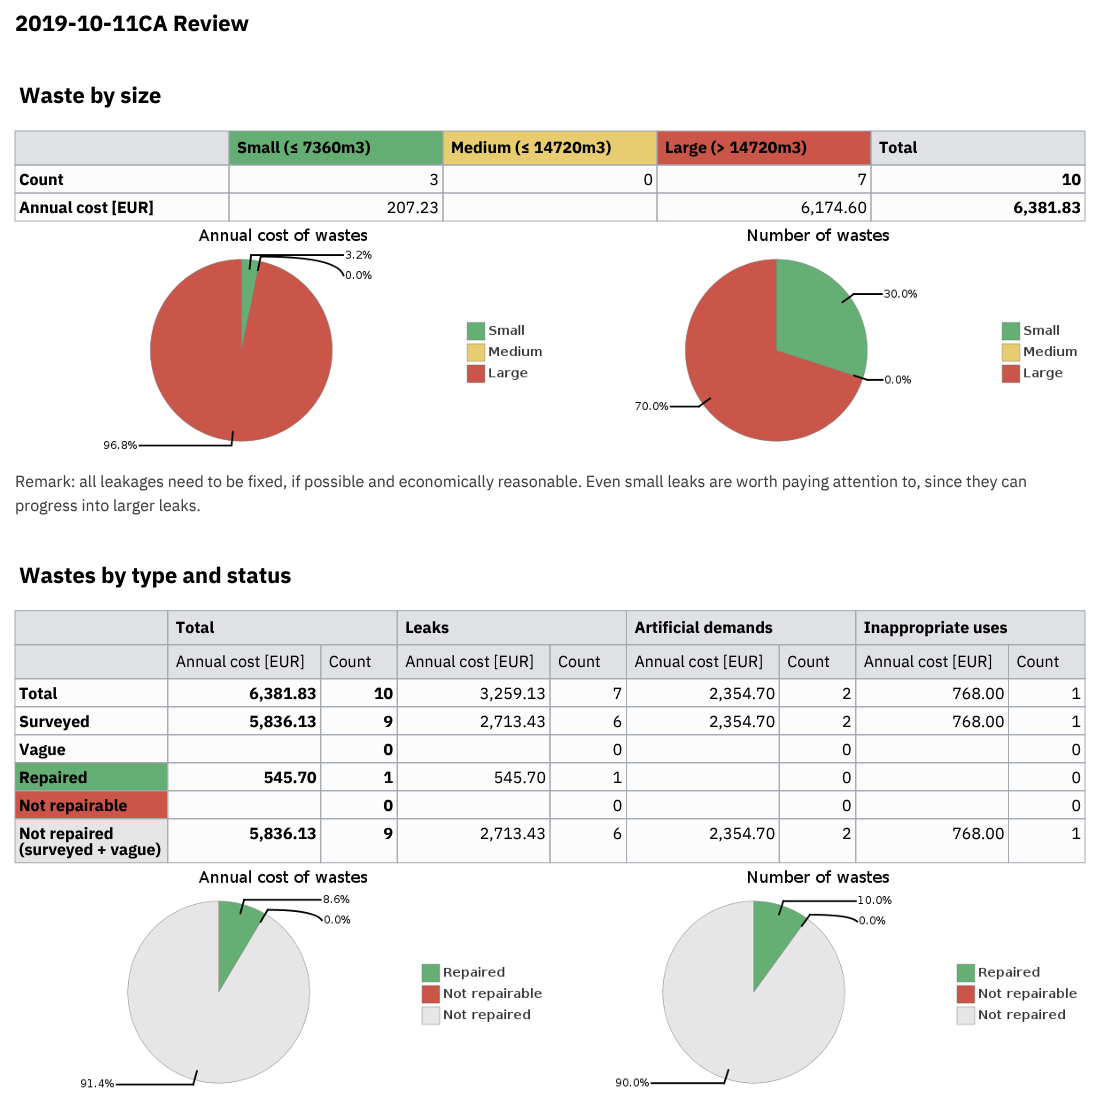
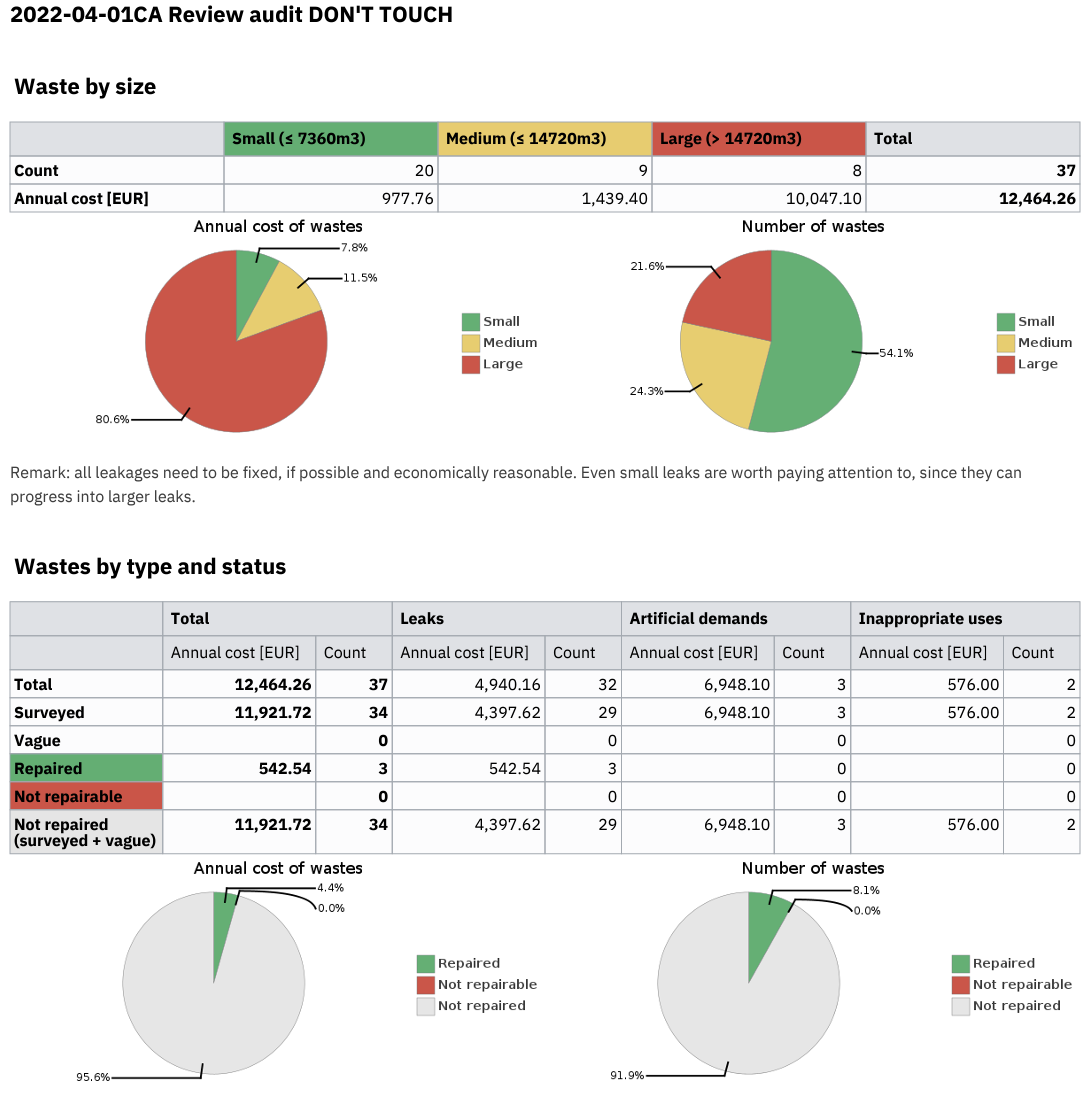
Waste size distribution section shows a table and a pie chart of leak sizes and types and their repair status, with an annual cost projection
Waste cost-benefit evaluation
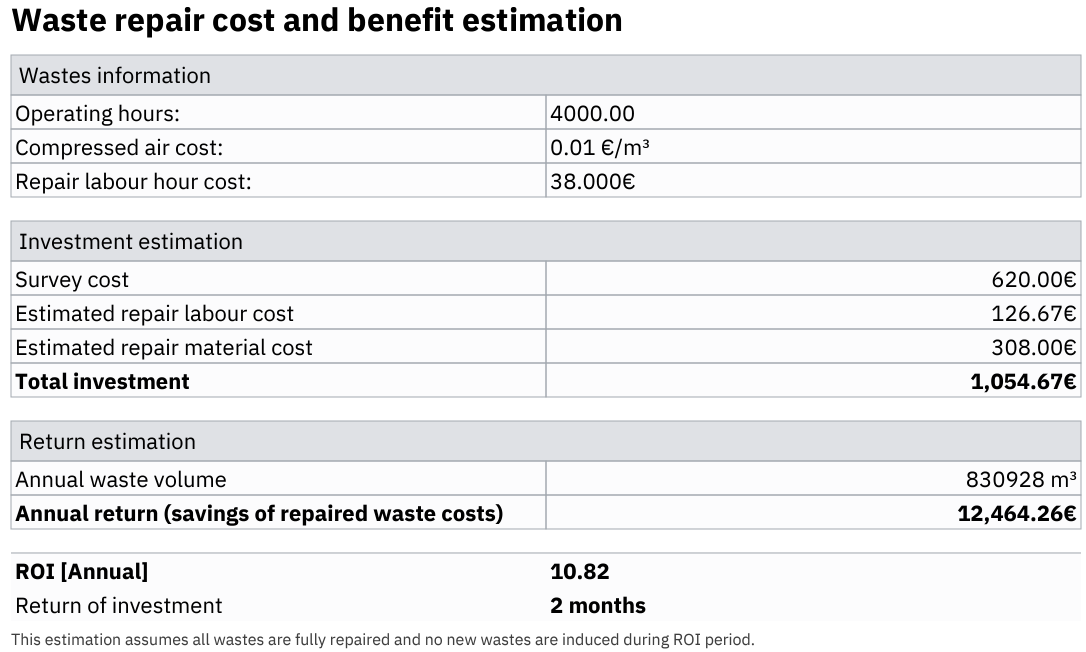
Waste cost-benefit evaluation section shows a table of waste volume in relation to the investment price and calculates a ROI.
Waste potential savings
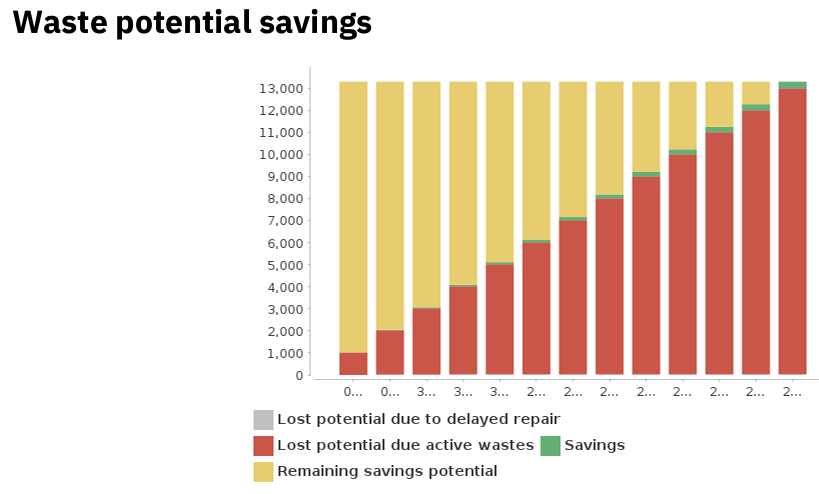
Waste potential savings section shows a graph of lost potential due to delayed repair and potential savings available.
Waste sustainability
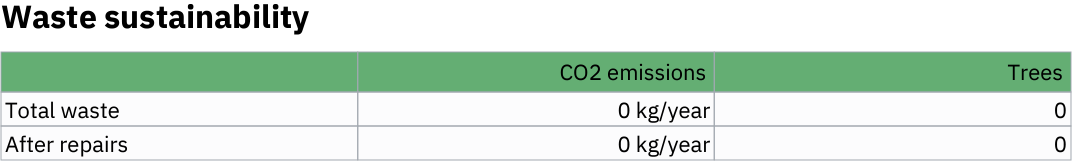
Waste sustainability section shows a small table of wasted CO2 and trees equivalent, based on the wastes in the wastes assessment.
Waste full table (for Excel)
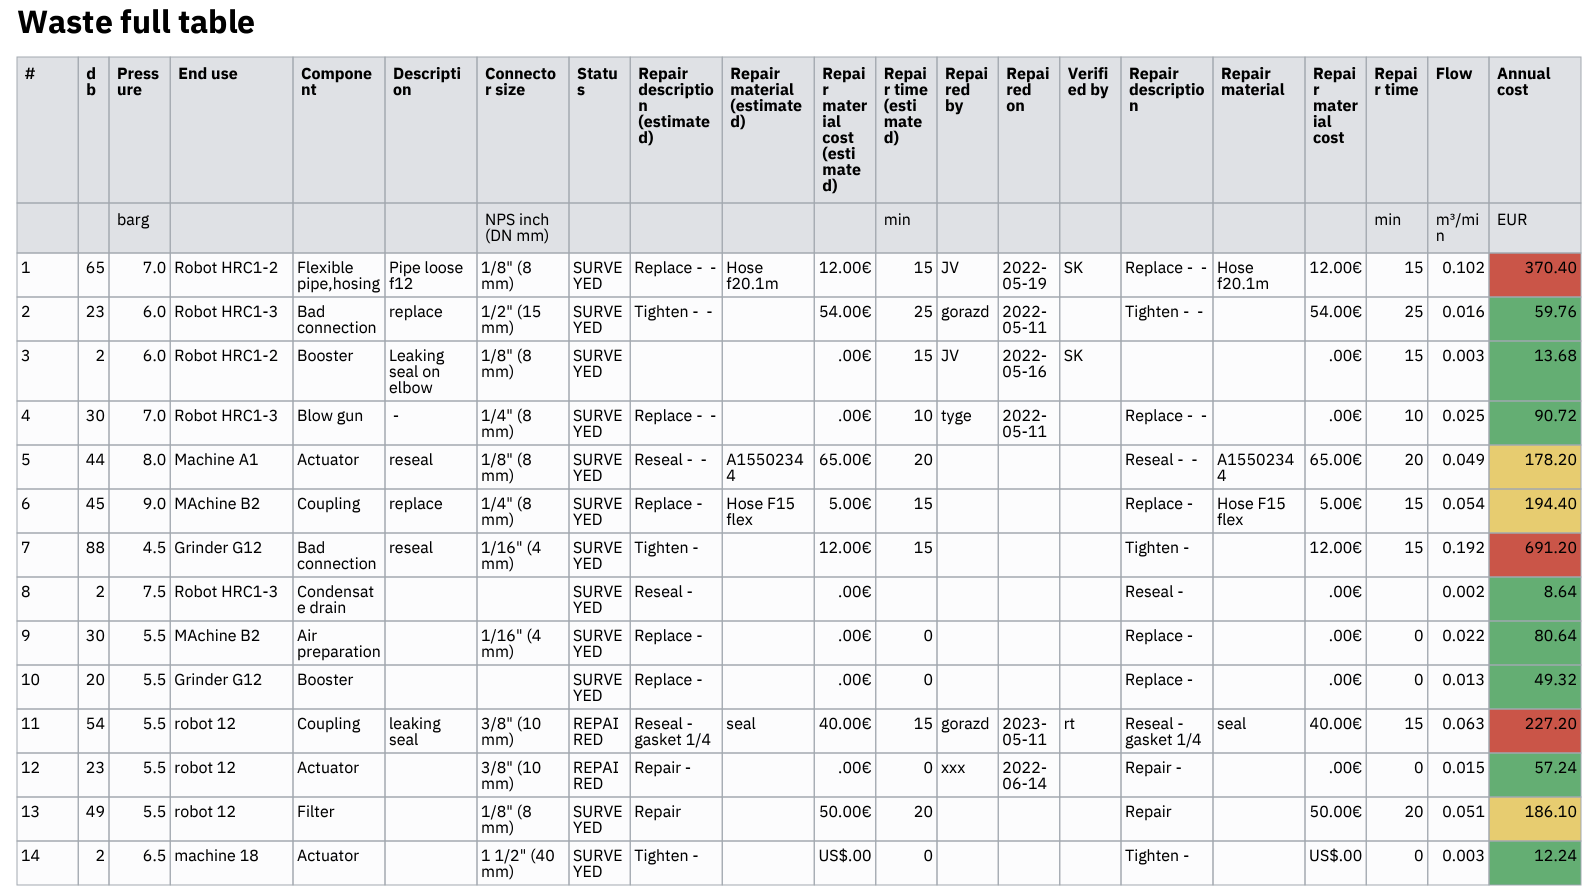

Waste full table section shows a full table of all wastes, best viewed as an excel file.
Waste survey table
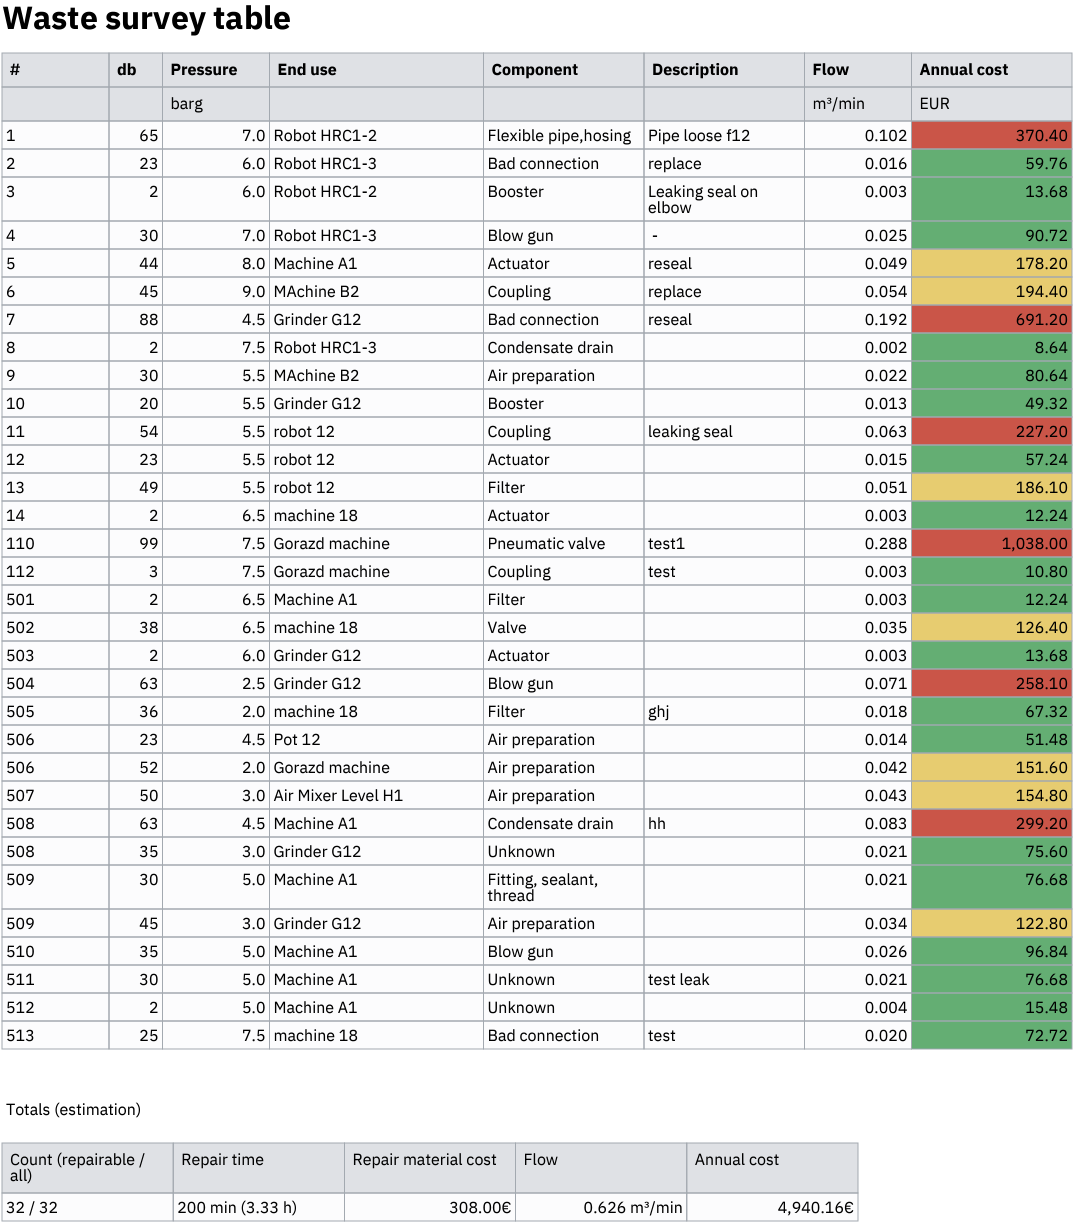
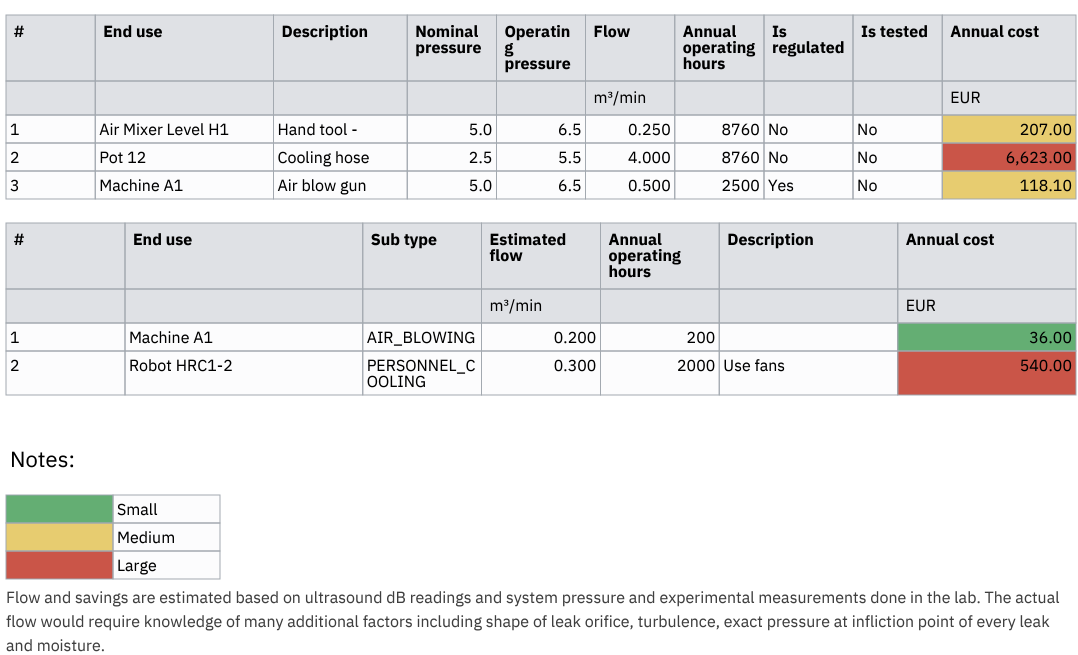
Waste survey table section shows a table of all surveyed wastes.
Waste repair table
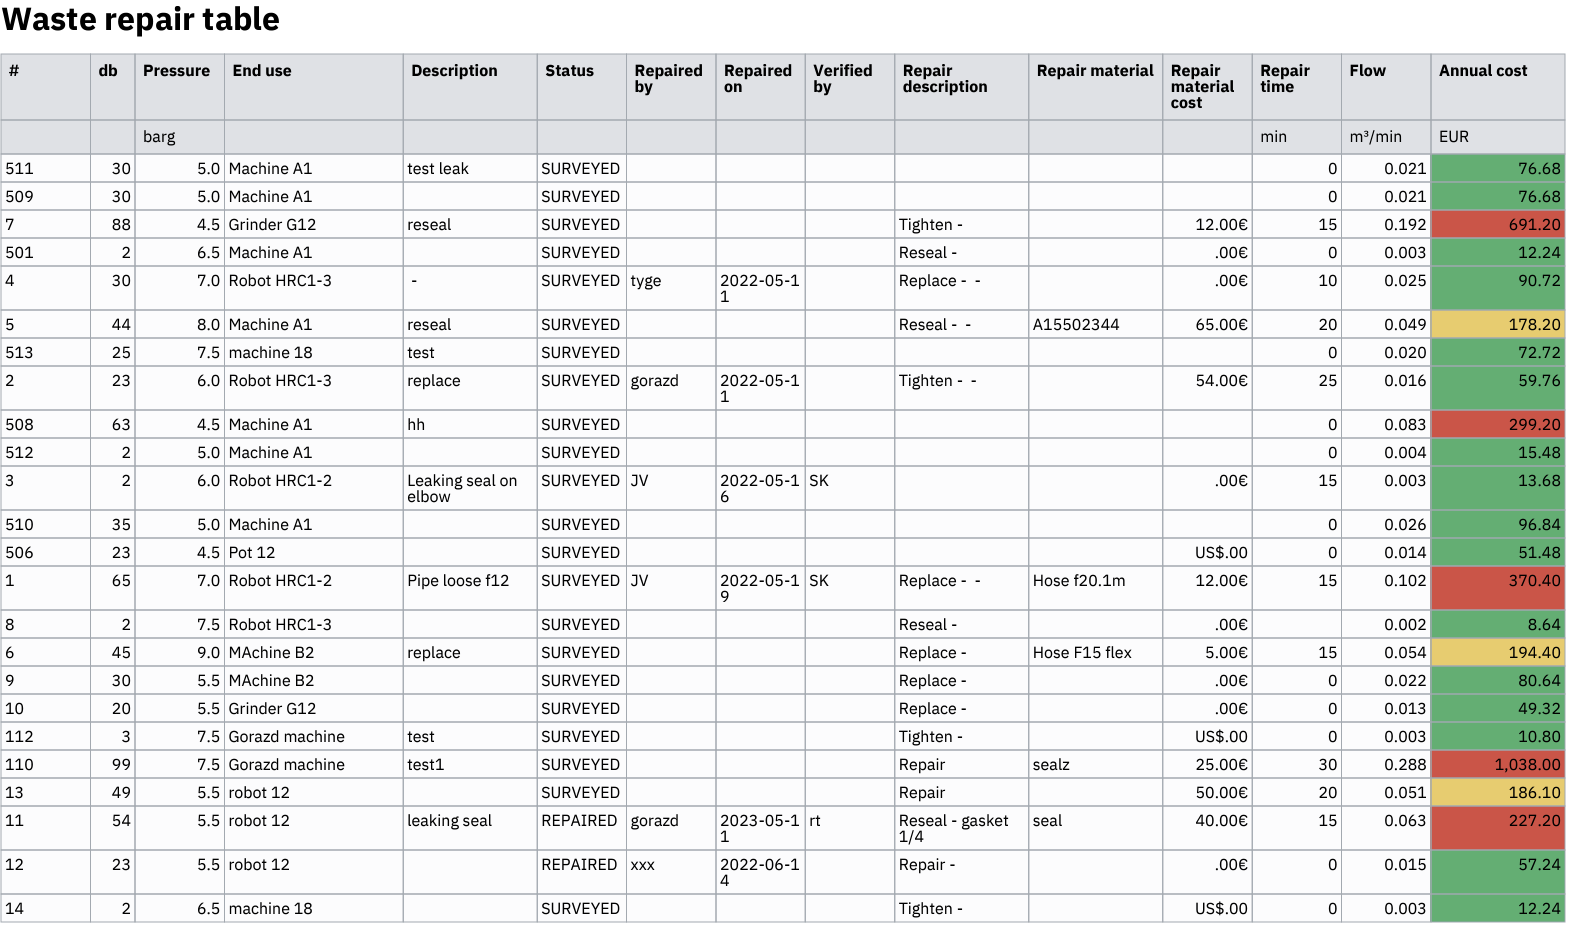
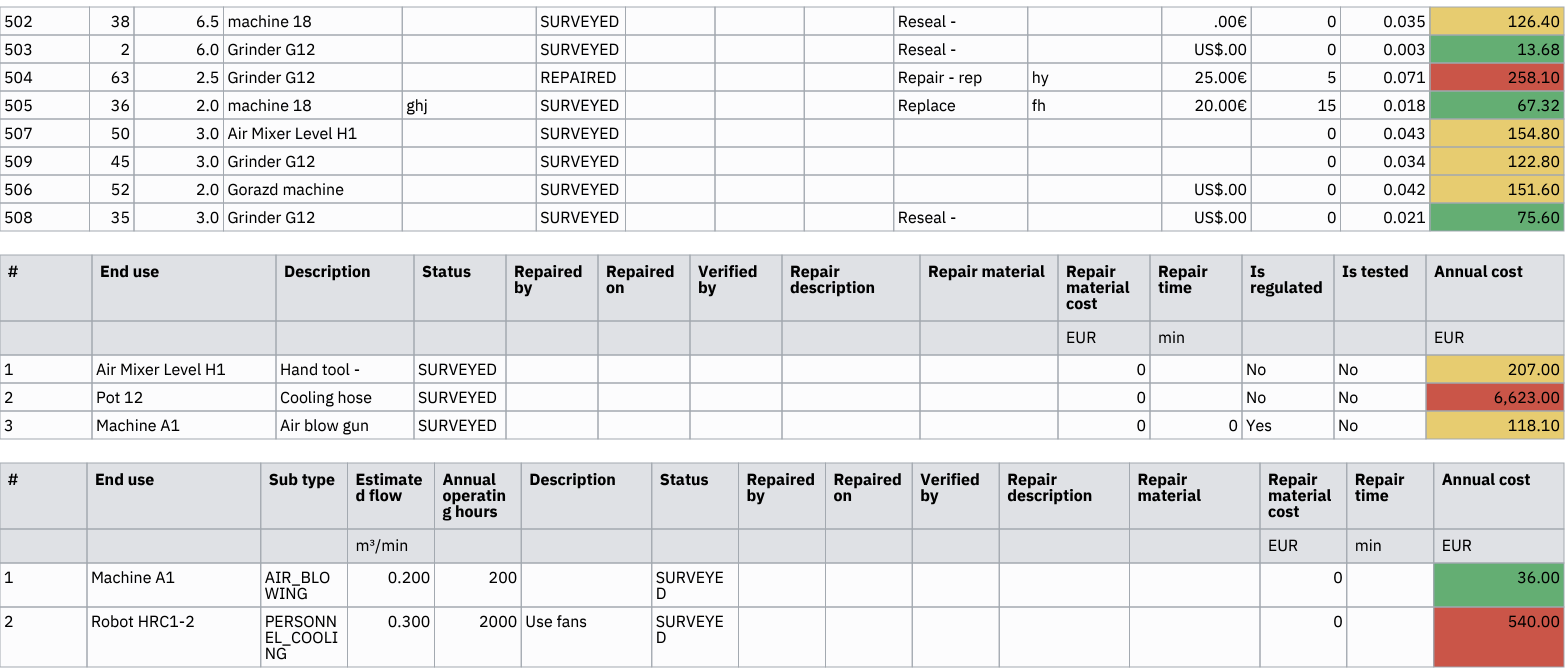
Waste repair table section shows a table of all surveyed and not repaired wastes.
Waste repair progress
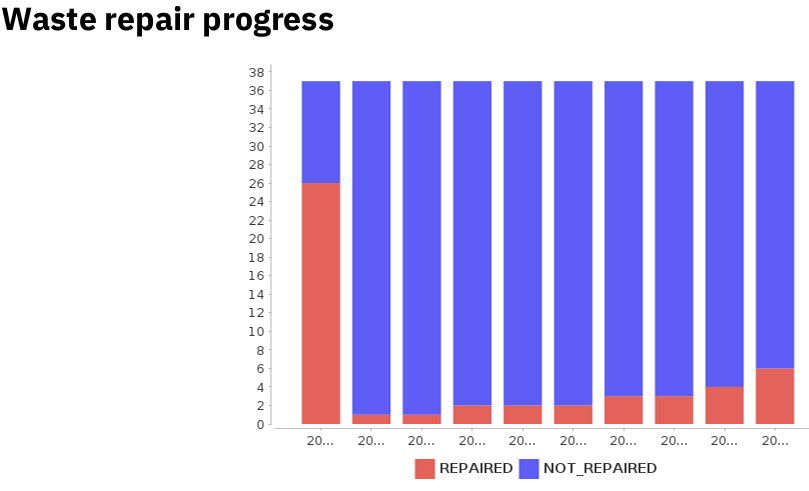
Waste repair progress sections shows a chart displaying the progress of repairing surveyed leaks.
Waste repair guide
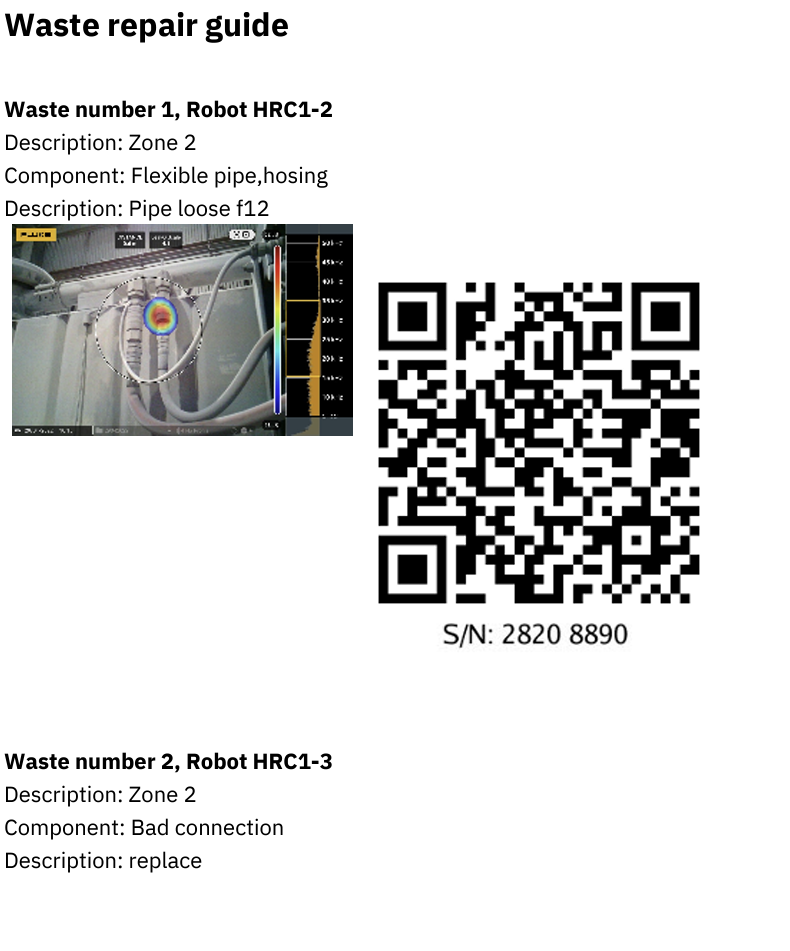
Waste repair guide section shows all unrepaired wastes in a format to be useful for field repairs.
Waste images
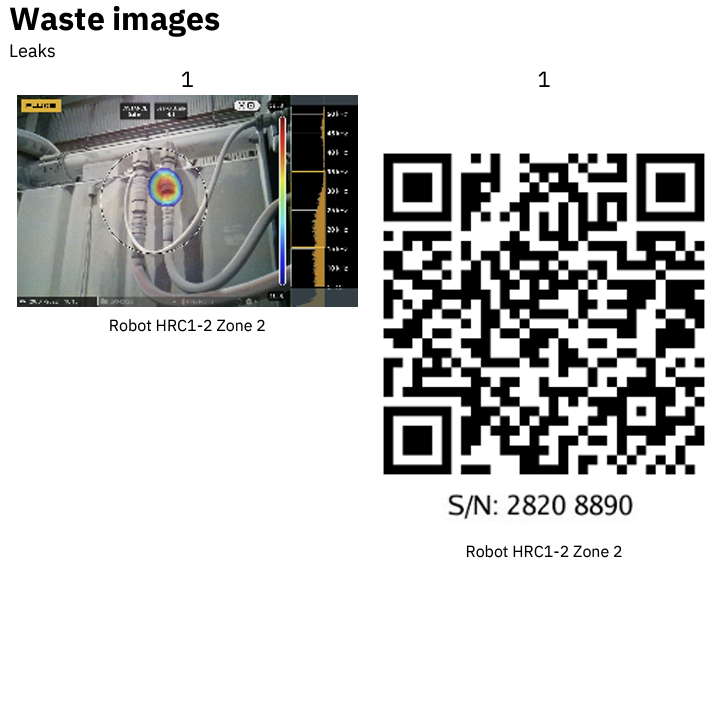
Waste images section shows all wastes and their images.
Stickers
Stickers section shows all leak wastes in a stickers format, useful for printing.
Audit sections
Note: All audit sections are based on the selected audit. If no audit is selected when creating the report, then the latest audit is used.
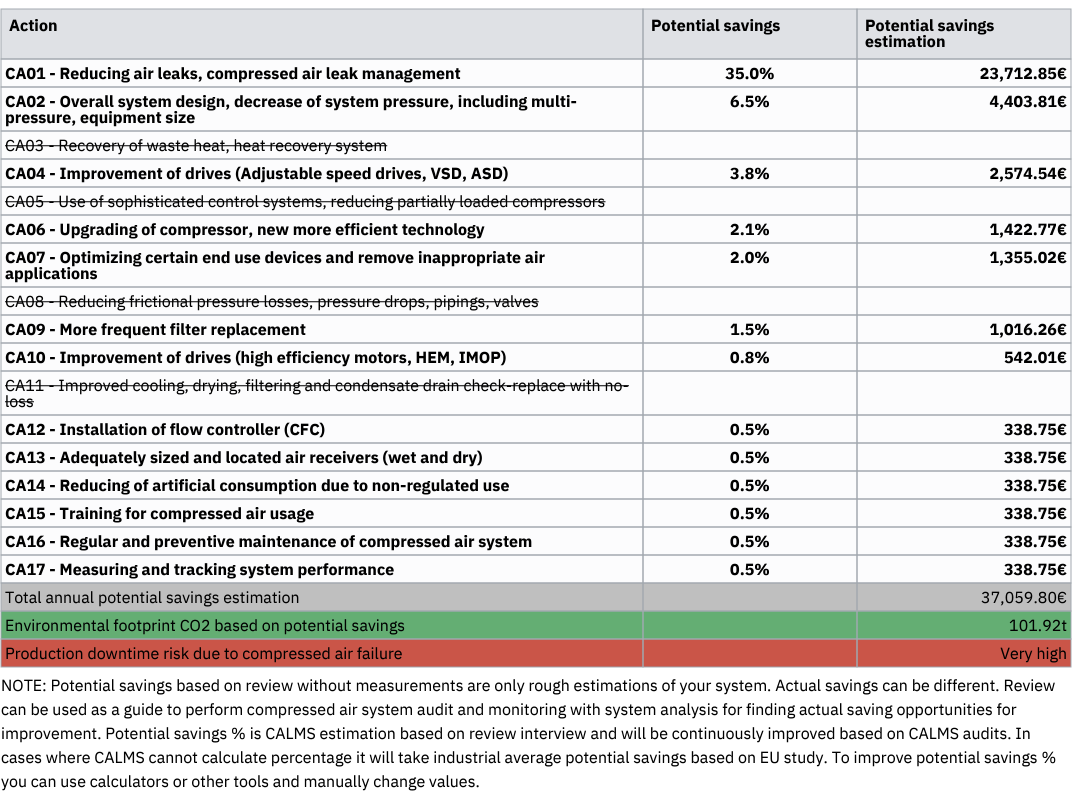
Audit actions
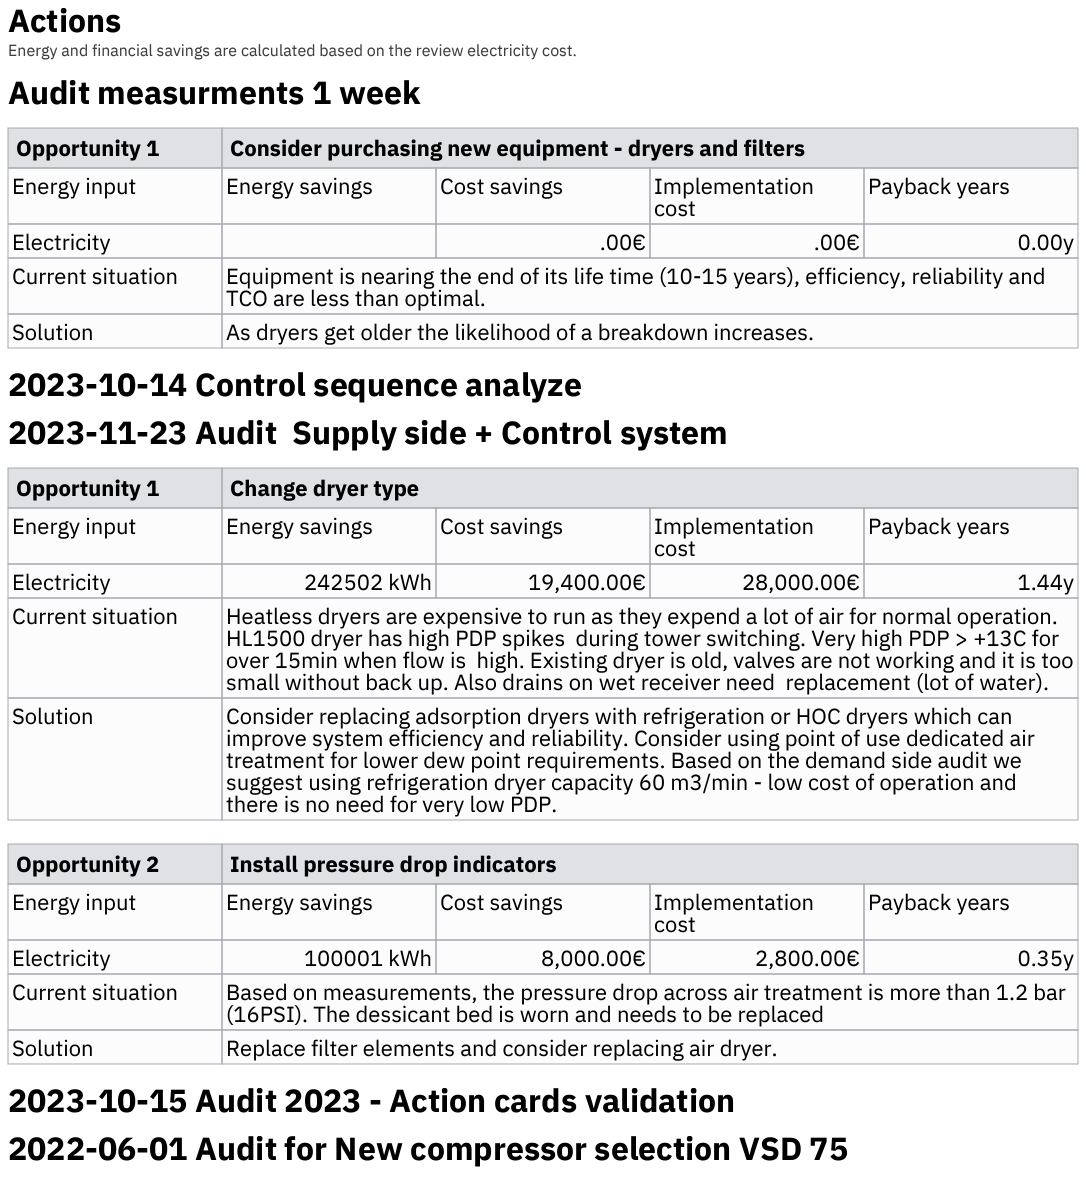
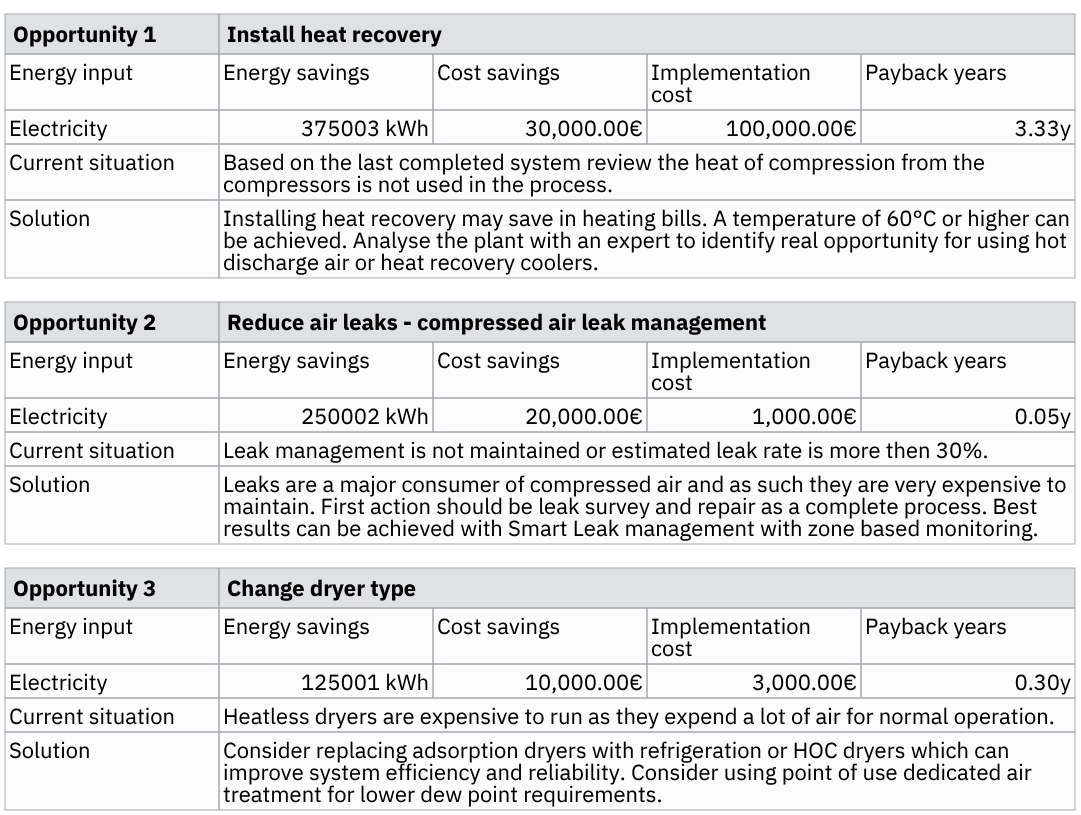
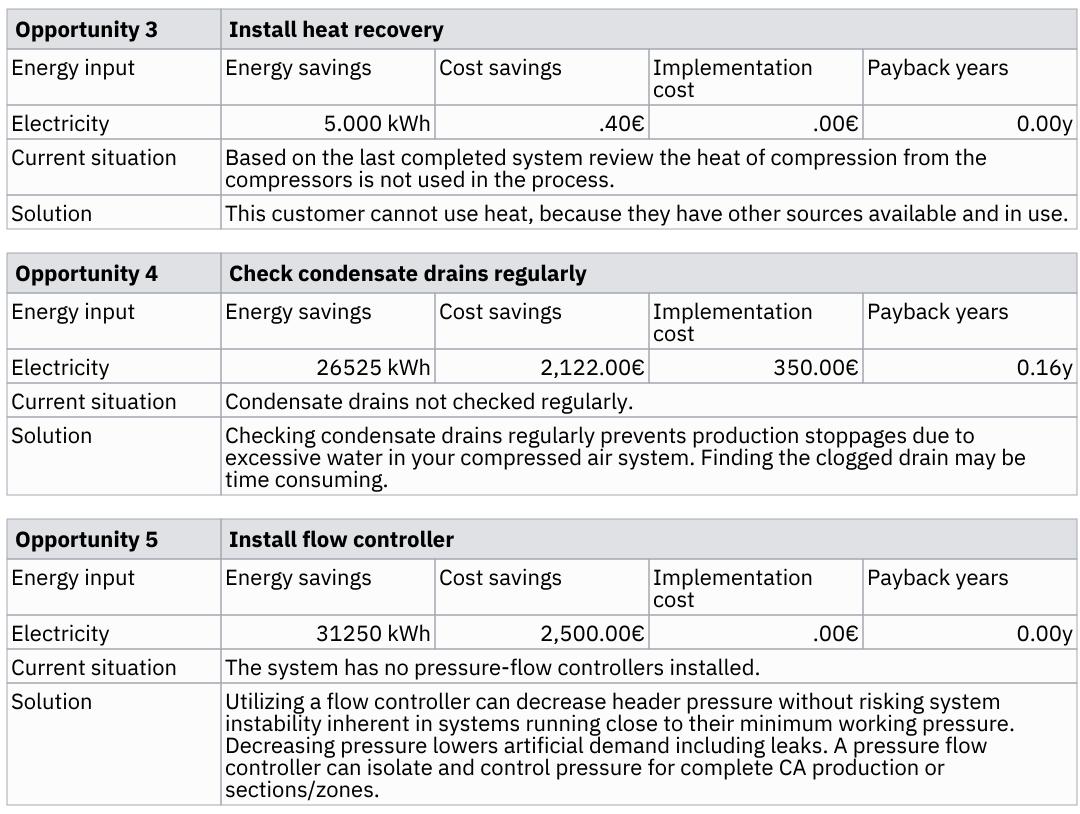
Audit actions section displays all optimization actions created in an audit.
Audit summary
Audit summary shows a short audit summary
Audit static image
Audit static image hidden section displays a process image of an audit.
Monitoring sections
Note: All monitoring sections are based on the selected period. If no period is selected you will not be able to show these sections.
Key performance indicators (for period)
Key performance indicators for period section shows all indicators, their targets and values. Same as Key performance indicators, but with a custom period.
Monitoring summary
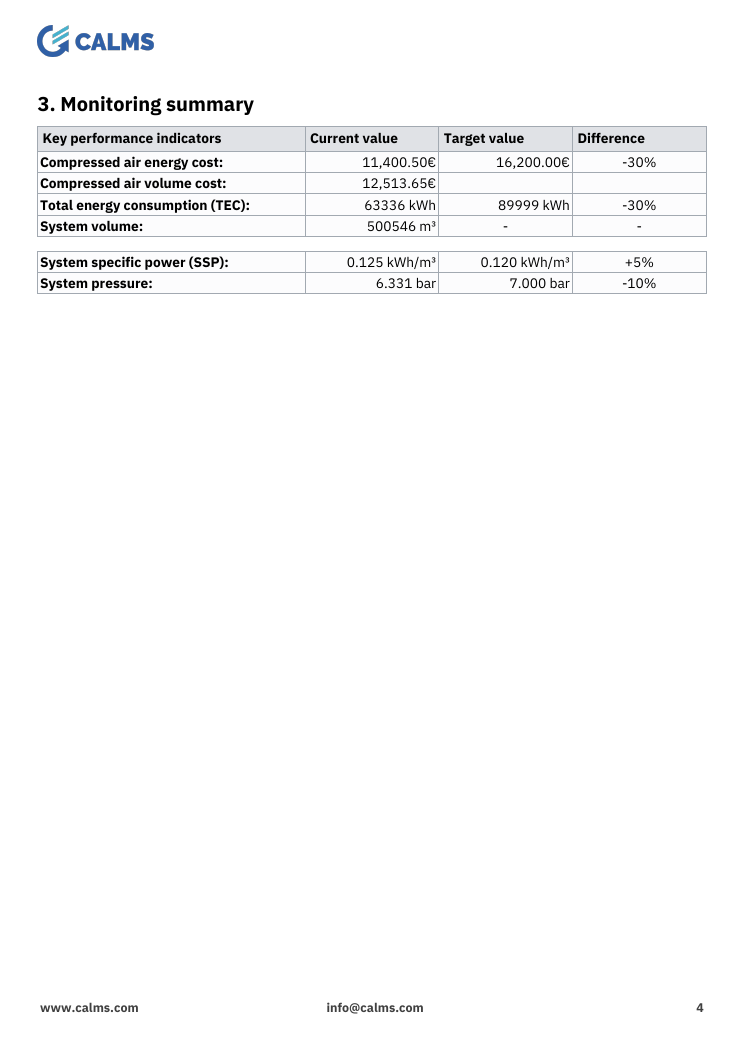
Monitoring summary section shows a predefined selection of channels in the system and their values.
It contains the following values and their targets:
- Compressed air energy cost
- Compressed air volume cost
- Total energy consumption
- System volume
- System specific power
- System pressure
Compressor performance
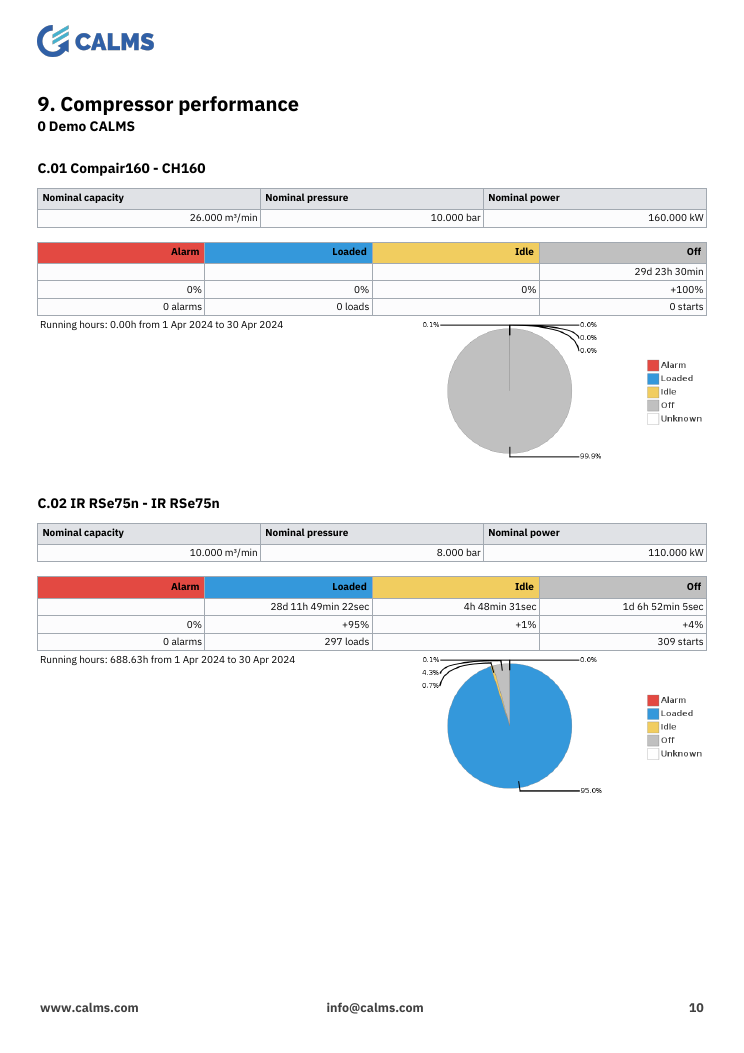
Compressor performance section shows the compressors in the system, and performance information about them.
It contains:
- Nominal capacity, pressure and power
- State counts for alarm, loaded, idle and off
- Running hours
- A pie chart of compressor states
Monitoring table
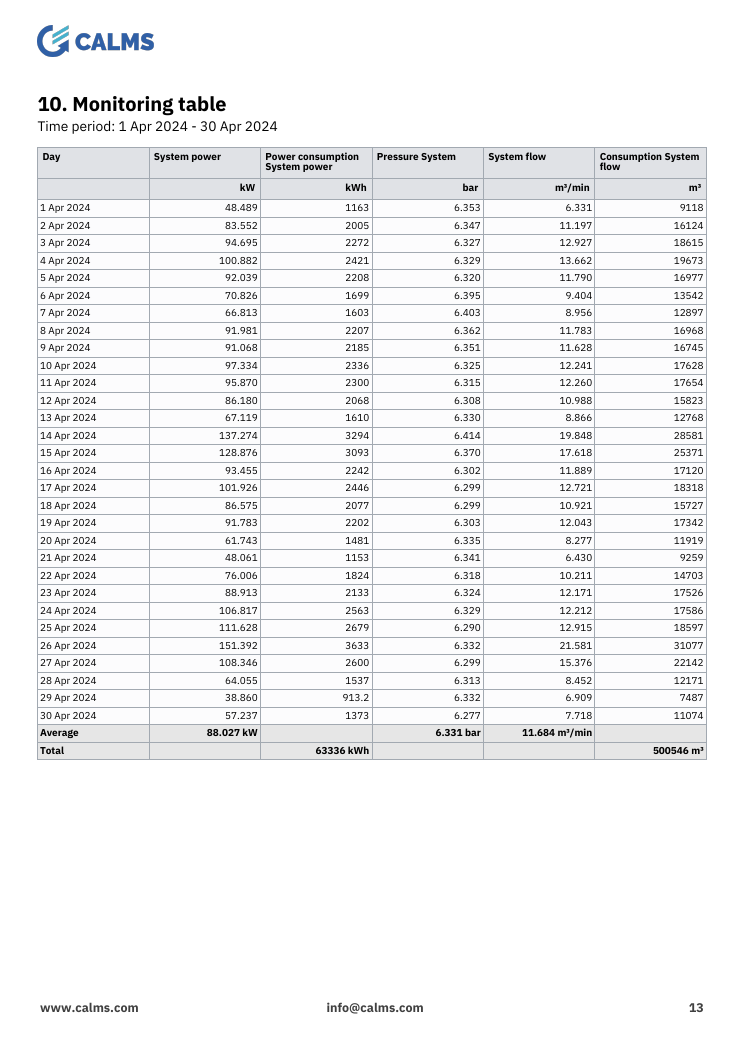
Monitoring table section shows all selected channels and their value in time, according to the selection chosen by the user. Values span in the user selected report time period, with the user selected aggregation. The table automatically shows integral (Totals) values for channels where appropriate.
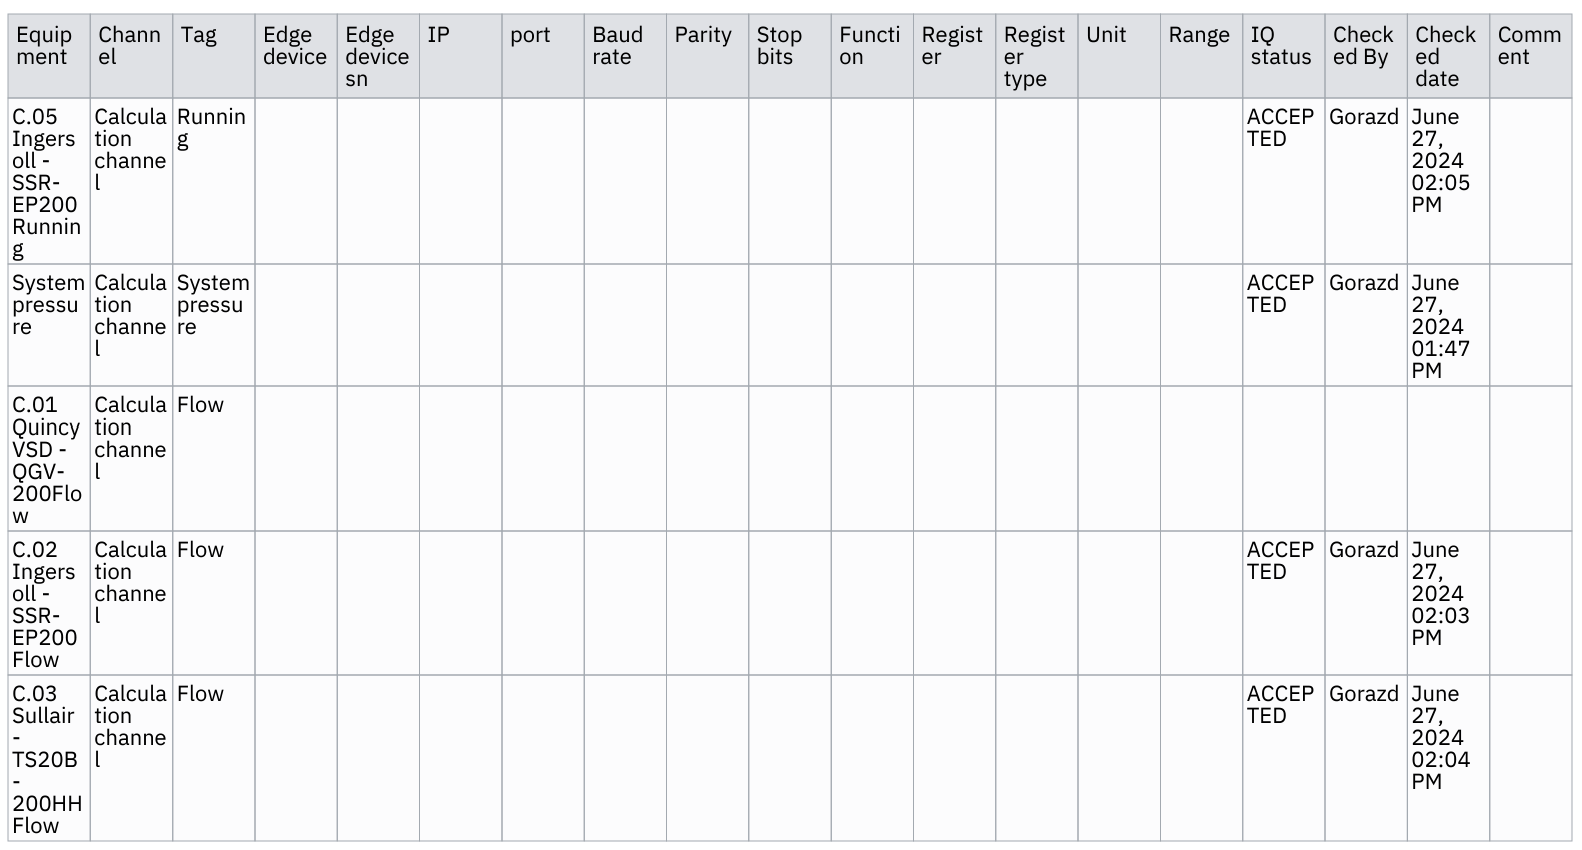
Channels table
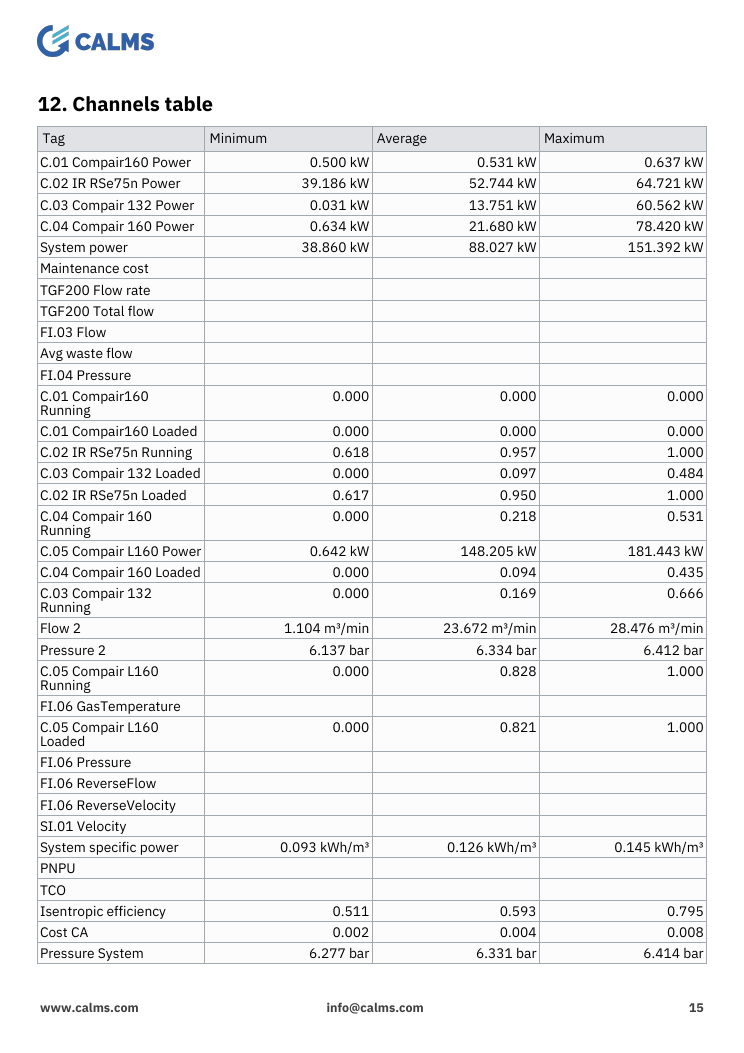
Channels table shows all selected channels and their minimum, maximum and average values in the report time period.
System savings potential
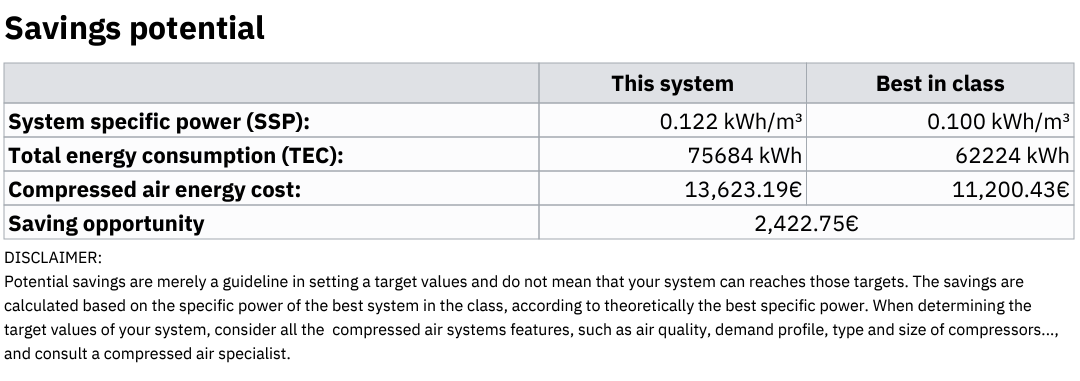
Savings potential section shows a comparison between current system and an ideal system based on flow specific power and a general idealized system flow specific power.
System sustainability
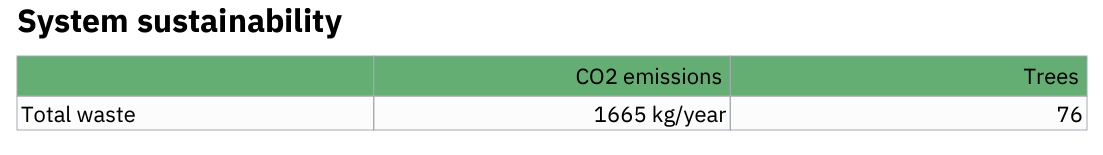
System sustainability section shows a small table of wasted CO2 and trees equivalent, based on the system power channel.
Monitoring charts
Data chart
Data chart section shows the user selected channel values in the report time period. It handles multiple channels, averages are shown with a line chart, totals with a bar chart.
Compressed air consumption chart
Compressed air consumption chart section is the same as a Data chart, but with the system volume channel preselected.
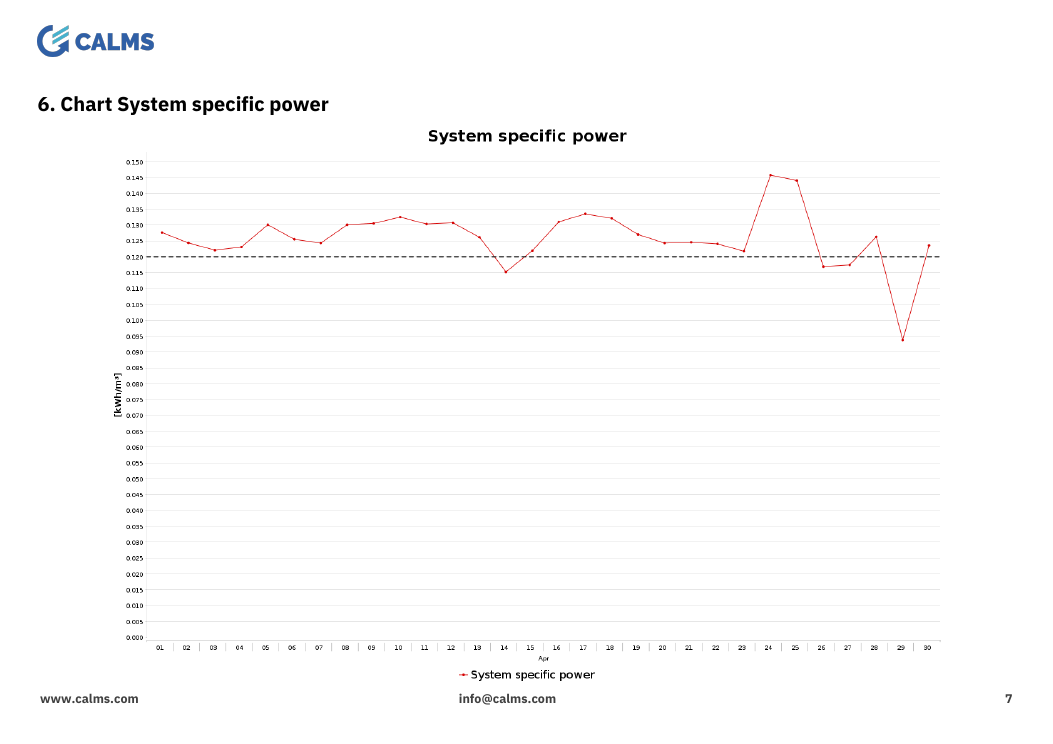
Compressed air energy efficiency chart
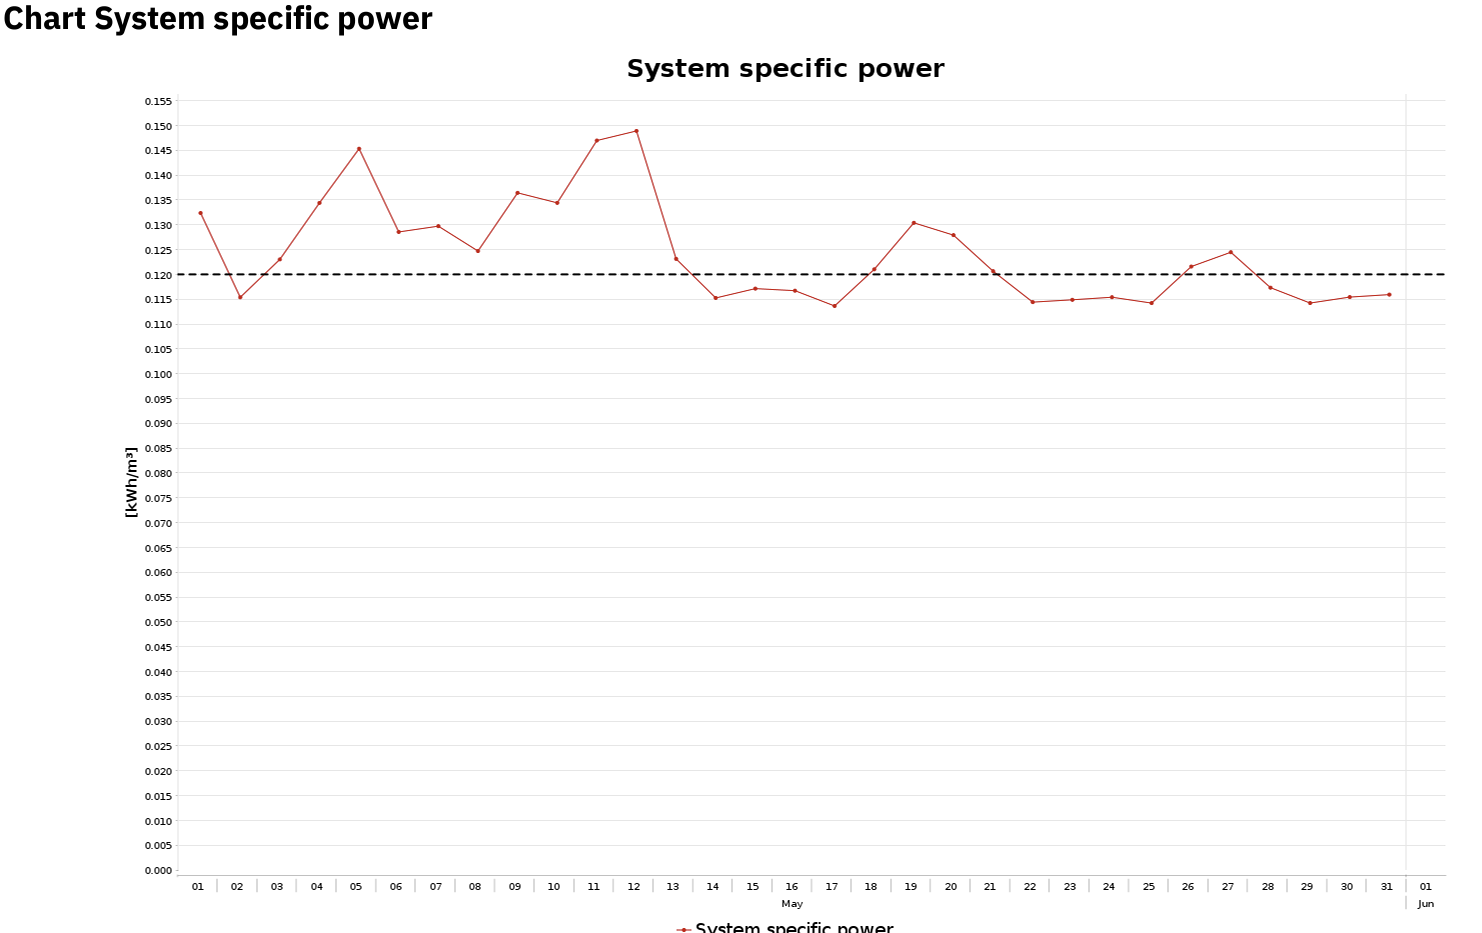
Compressed air energy efficiency chart section is the same as a Data chart, but with the system flow specific power channel preselected.
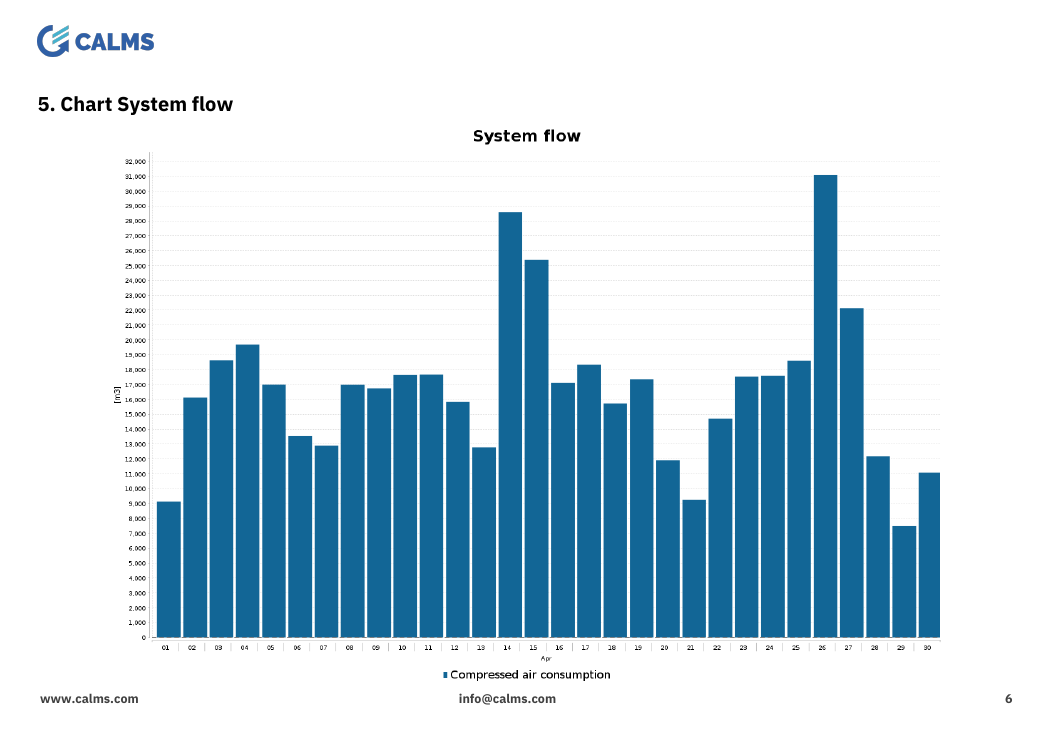
System flow chart
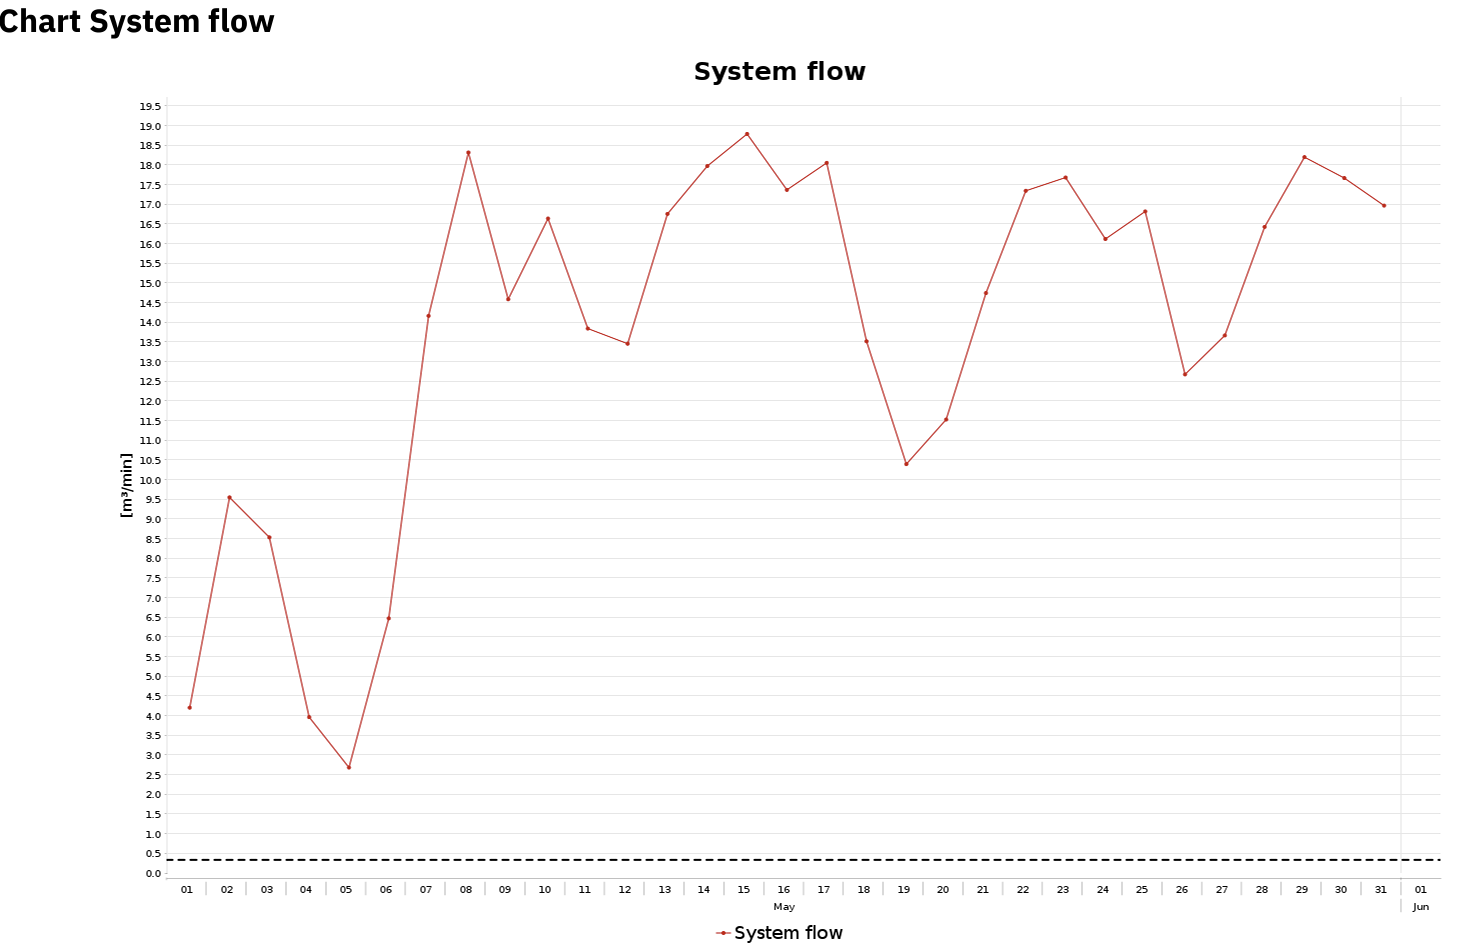
System flow chart section is the same as a Data chart, but with the system flow channel preselected.
System pressure chart
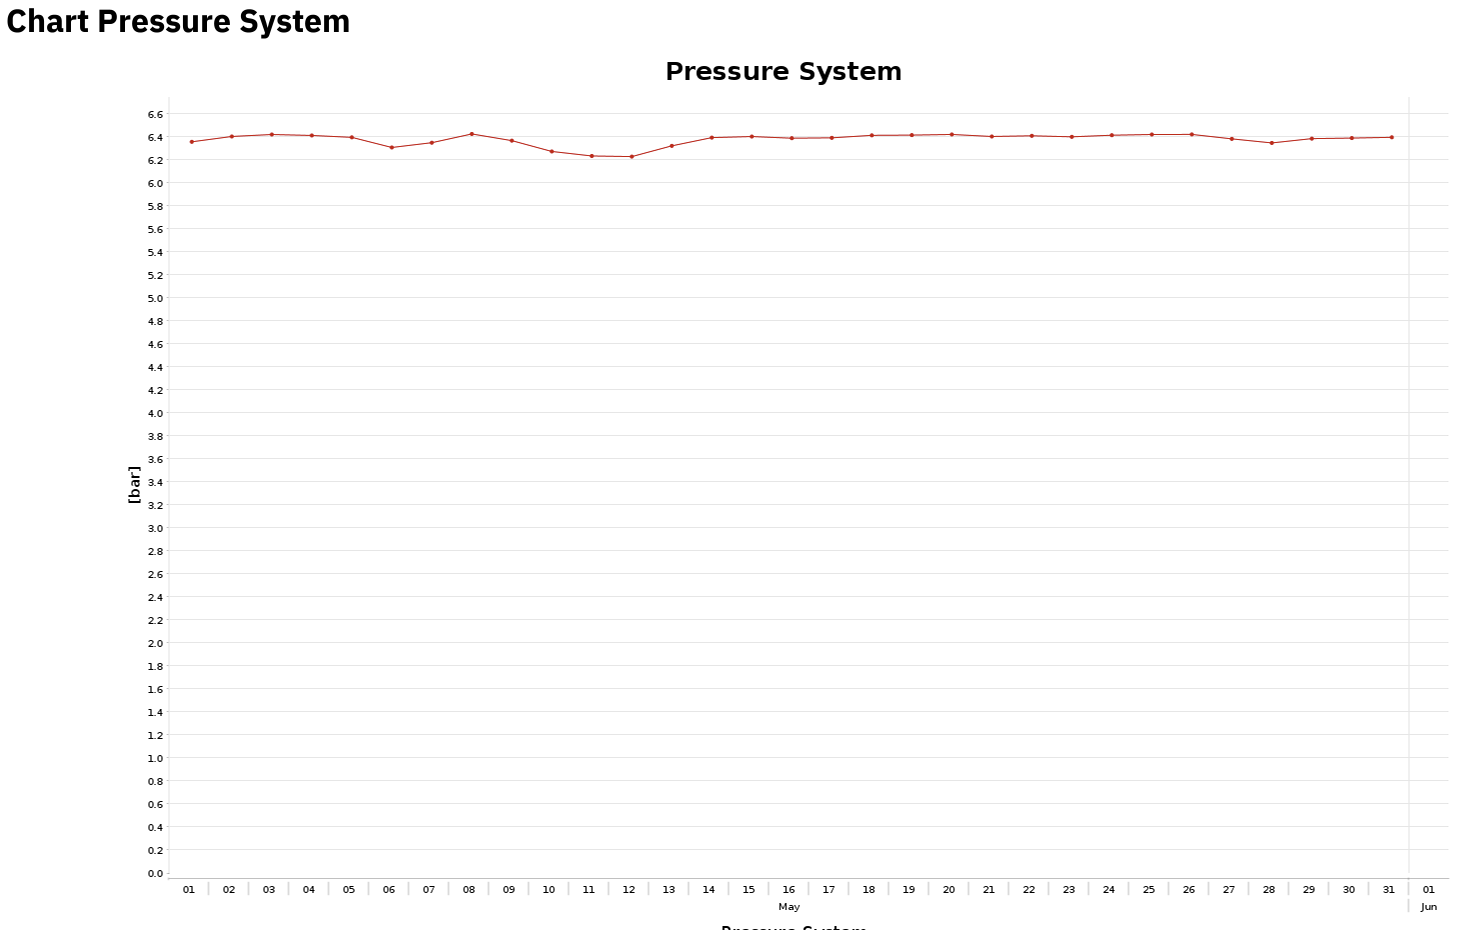
System pressure chart section is the same as a Data chart, but with the system pressure channel preselected.
Assets sections
Total cost of ownership
Total cost of ownership section shows a table containing info about the selected total cost of ownership (TCO)
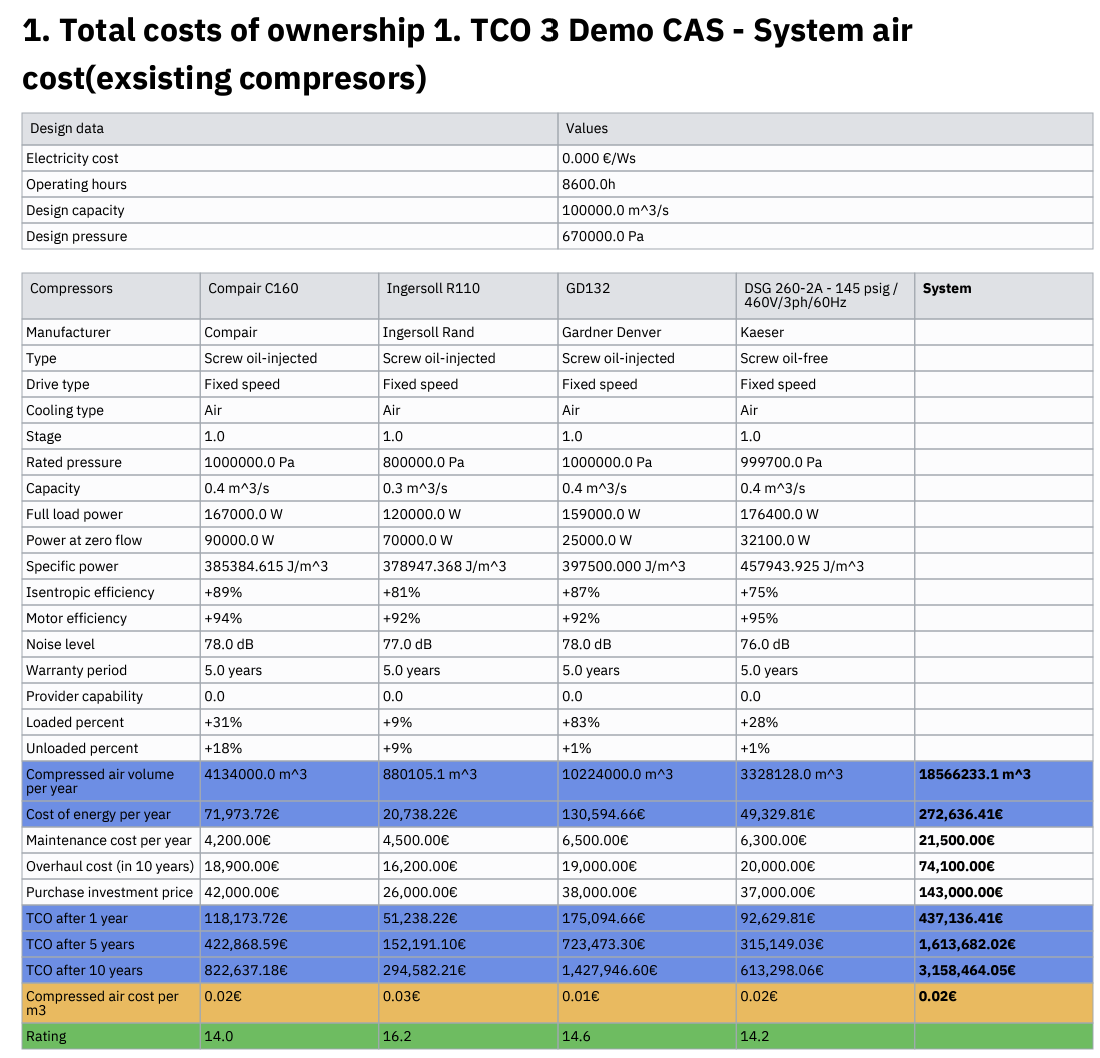
Total costs of ownership comparison
Total costs of ownership comparison section shows a table comparing all selected total costs of ownerships (TCOs), for purchasing new compressors and compare to existing ones.
Equipment list
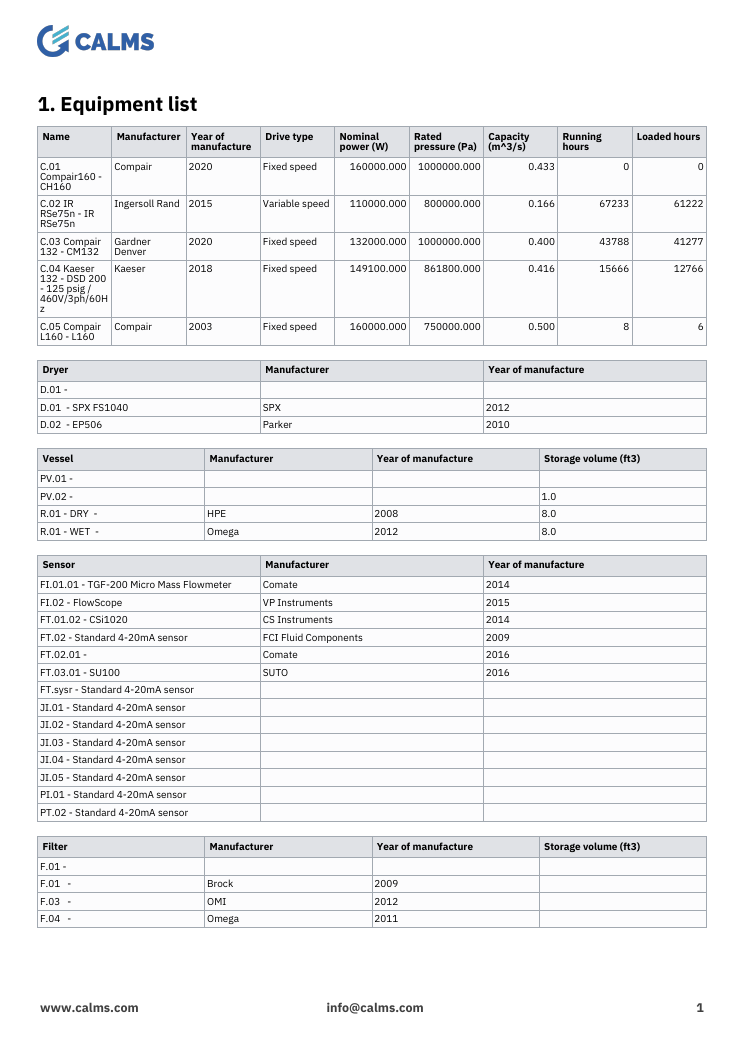
Equipment list section shows a table of equipments in the system, as shown in the assets > equipment tab.
Currently unavailable
Table inspect aggregate
Currently unavailable. You can get this information in the Monitoring table section
Chart inspect aggregate
Currently unavailable, please download the plot from inspect and use an image section.
Chart cusum
Currently unavailable, please download the plot from inspect and use an image section.
Chart M&T
Currently unavailable, please download the plot from inspect and use an image section.
Company details
Currently deprecated, same data is in Data reference section
Review details
Currently deprecated, same data is in Data reference section